EX-99.2
Published on October 15, 2024

Exhibit 99.2 O c t o b e r 1 5 , 2 0 2 4 Lender Presentation MIDDLETOWN
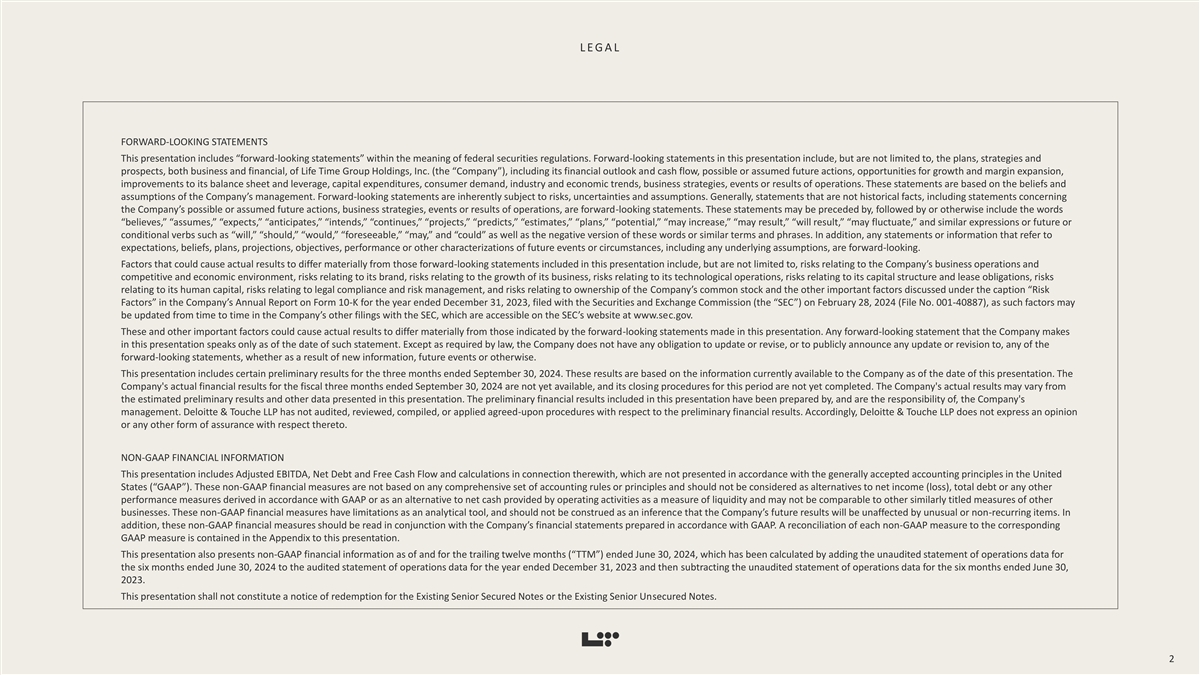
L E G A L FORWARD-LOOKING STATEMENTS This presentation includes “forward-looking statements” within the meaning of federal securities regulations. Forward-looking statements in this presentation include, but are not limited to, the plans, strategies and prospects, both business and financial, of Life Time Group Holdings, Inc. (the “Company”), including its financial outlook and cash flow, possible or assumed future actions, opportunities for growth and margin expansion, improvements to its balance sheet and leverage, capital expenditures, consumer demand, industry and economic trends, business strategies, events or results of operations. These statements are based on the beliefs and assumptions of the Company’s management. Forward-looking statements are inherently subject to risks, uncertainties and assumptions. Generally, statements that are not historical facts, including statements concerning the Company’s possible or assumed future actions, business strategies, events or results of operations, are forward-looking statements. These statements may be preceded by, followed by or otherwise include the words “believes,” “assumes,” “expects,” “anticipates,” “intends,” “continues,” “projects,” “predicts,” “estimates,” “plans,” “potential,” “may increase,” “may result,” “will result,” “may fluctuate,” and similar expressions or future or conditional verbs such as “will,” “should,” “would,” “foreseeable,” “may,” and “could” as well as the negative version of these words or similar terms and phrases. In addition, any statements or information that refer to expectations, beliefs, plans, projections, objectives, performance or other characterizations of future events or circumstances, including any underlying assumptions, are forward-looking. Factors that could cause actual results to differ materially from those forward-looking statements included in this presentation include, but are not limited to, risks relating to the Company’s business operations and competitive and economic environment, risks relating to its brand, risks relating to the growth of its business, risks relating to its technological operations, risks relating to its capital structure and lease obligations, risks relating to its human capital, risks relating to legal compliance and risk management, and risks relating to ownership of the Company’s common stock and the other important factors discussed under the caption “Risk Factors” in the Company’s Annual Report on Form 10-K for the year ended December 31, 2023, filed with the Securities and Exchange Commission (the “SEC”) on February 28, 2024 (File No. 001-40887), as such factors may be updated from time to time in the Company’s other filings with the SEC, which are accessible on the SEC’s website at www.sec.gov. These and other important factors could cause actual results to differ materially from those indicated by the forward-looking statements made in this presentation. Any forward-looking statement that the Company makes in this presentation speaks only as of the date of such statement. Except as required by law, the Company does not have any obligation to update or revise, or to publicly announce any update or revision to, any of the forward-looking statements, whether as a result of new information, future events or otherwise. This presentation includes certain preliminary results for the three months ended September 30, 2024. These results are based on the information currently available to the Company as of the date of this presentation. The Company's actual financial results for the fiscal three months ended September 30, 2024 are not yet available, and its closing procedures for this period are not yet completed. The Company's actual results may vary from the estimated preliminary results and other data presented in this presentation. The preliminary financial results included in this presentation have been prepared by, and are the responsibility of, the Company's management. Deloitte & Touche LLP has not audited, reviewed, compiled, or applied agreed-upon procedures with respect to the preliminary financial results. Accordingly, Deloitte & Touche LLP does not express an opinion or any other form of assurance with respect thereto. NON-GAAP FINANCIAL INFORMATION This presentation includes Adjusted EBITDA, Net Debt and Free Cash Flow and calculations in connection therewith, which are not presented in accordance with the generally accepted accounting principles in the United States (“GAAP”). These non-GAAP financial measures are not based on any comprehensive set of accounting rules or principles and should not be considered as alternatives to net income (loss), total debt or any other performance measures derived in accordance with GAAP or as an alternative to net cash provided by operating activities as a measure of liquidity and may not be comparable to other similarly titled measures of other businesses. These non-GAAP financial measures have limitations as an analytical tool, and should not be construed as an inference that the Company’s future results will be unaffected by unusual or non-recurring items. In addition, these non-GAAP financial measures should be read in conjunction with the Company’s financial statements prepared in accordance with GAAP. A reconciliation of each non-GAAP measure to the corresponding GAAP measure is contained in the Appendix to this presentation. This presentation also presents non-GAAP financial information as of and for the trailing twelve months (“TTM”) ended June 30, 2024, which has been calculated by adding the unaudited statement of operations data for the six months ended June 30, 2024 to the audited statement of operations data for the year ended December 31, 2023 and then subtracting the unaudited statement of operations data for the six months ended June 30, 2023. This presentation shall not constitute a notice of redemption for the Existing Senior Secured Notes or the Existing Senior Unsecured Notes. 2
T O D AY ’ S P R E S E N T E R S & A G E N D A 1. Transaction Overview B A H R A M A K R A D I 2. Company Overview Chairman Chief Executive Officer & Founder 3. Key Credit Highlights 4. Financial Overview 5. Appendix E R I K W E AV E R Executive Vice President Chief Financial Officer 3 3 81nidZpGqzkSDMpD

4
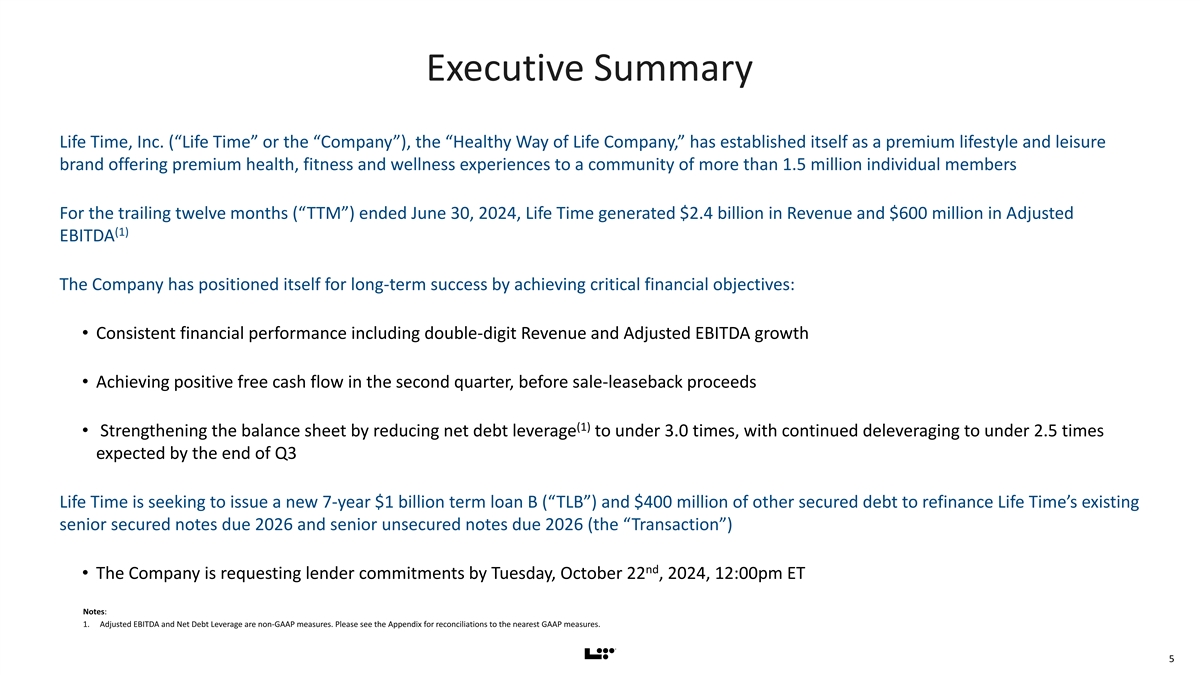
Executive Summary Life Time, Inc. (“Life Time” or the “Company”), the “Healthy Way of Life Company,” has established itself as a premium lifestyle and leisure brand offering premium health, fitness and wellness experiences to a community of more than 1.5 million individual members For the trailing twelve months (“TTM”) ended June 30, 2024, Life Time generated $2.4 billion in Revenue and $600 million in Adjusted (1) EBITDA The Company has positioned itself for long-term success by achieving critical financial objectives: • Consistent financial performance including double-digit Revenue and Adjusted EBITDA growth • Achieving positive free cash flow in the second quarter, before sale-leaseback proceeds (1) • Strengthening the balance sheet by reducing net debt leverage to under 3.0 times, with continued deleveraging to under 2.5 times expected by the end of Q3 Life Time is seeking to issue a new 7-year $1 billion term loan B (“TLB”) and $400 million of other secured debt to refinance Life Time’s existing senior secured notes due 2026 and senior unsecured notes due 2026 (the “Transaction”) nd • The Company is requesting lender commitments by Tuesday, October 22 , 2024, 12:00pm ET Notes: 1. Adjusted EBITDA and Net Debt Leverage are non-GAAP measures. Please see the Appendix for reconciliations to the nearest GAAP measures. 5 81nidZpGqzkSDMpD
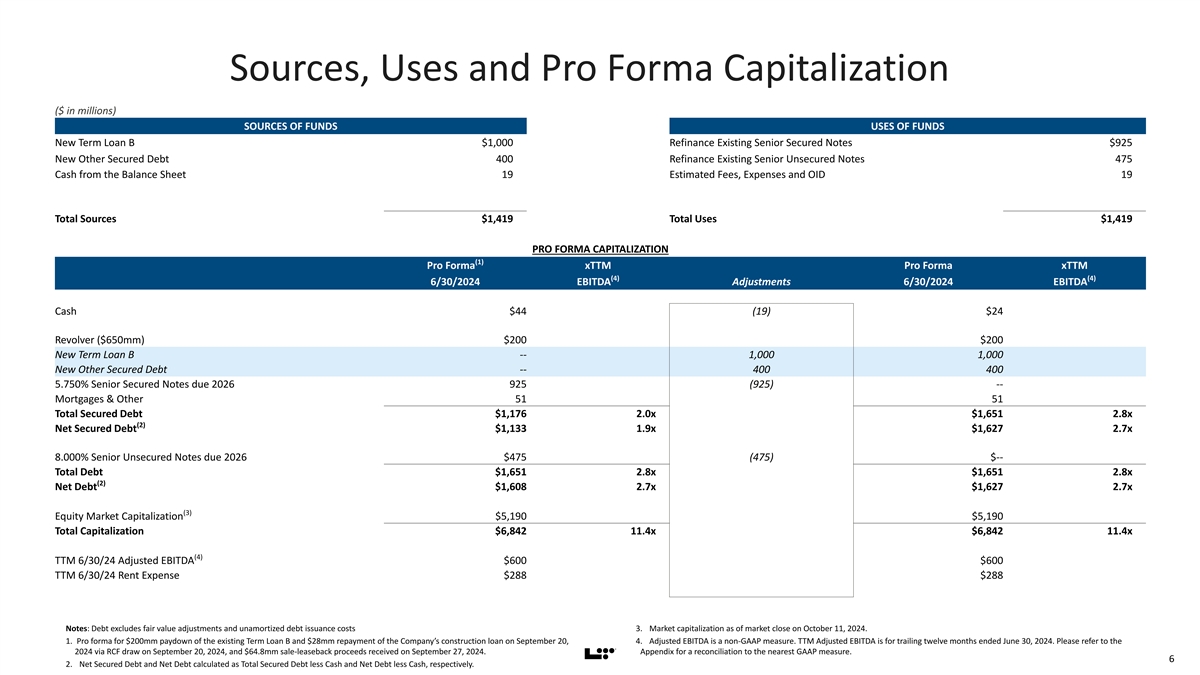
Sources, Uses and Pro Forma Capitalization ($ in millions) SOURCES OF FUNDS USES OF FUNDS New Term Loan B $1,000 Refinance Existing Senior Secured Notes $925 New Other Secured Debt 400 Refinance Existing Senior Unsecured Notes 475 Cash from the Balance Sheet 19 Estimated Fees, Expenses and OID 19 Total Sources $1,419 Total Uses $1,419 PRO FORMA CAPITALIZATION (1) Pro Forma xTTM Pro Forma xTTM (4) (4) 6/30/2024 EBITDA Adjustments 6/30/2024 EBITDA Cash $44 (19) $24 Revolver ($650mm) $200 $200 New Term Loan B -- 1,000 1,000 New Other Secured Debt -- 400 400 5.750% Senior Secured Notes due 2026 925 (925) -- Mortgages & Other 51 51 Total Secured Debt $1,176 2.0x $1,651 2.8x (2) Net Secured Debt $1,133 1.9x $1,627 2.7x 8.000% Senior Unsecured Notes due 2026 $475 (475) $-- Total Debt $1,651 2.8x $1,651 2.8x (2) Net Debt $1,608 2.7x $1,627 2.7x (3) Equity Market Capitalization $5,190 $5,190 Total Capitalization $6,842 11.4x $6,842 11.4x (4) TTM 6/30/24 Adjusted EBITDA $600 $600 TTM 6/30/24 Rent Expense $288 $288 Notes: Debt excludes fair value adjustments and unamortized debt issuance costs 3. Market capitalization as of market close on October 11, 2024. 1. Pro forma for $200mm paydown of the existing Term Loan B and $28mm repayment of the Company’s construction loan on September 20, 4. Adjusted EBITDA is a non-GAAP measure. TTM Adjusted EBITDA is for trailing twelve months ended June 30, 2024. Please refer to the 2024 via RCF draw on September 20, 2024, and $64.8mm sale-leaseback proceeds received on September 27, 2024. Appendix for a reconciliation to the nearest GAAP measure. 6 2. Net Secured Debt and Net Debt calculated as Total Secured Debt less Cash and Net Debt less Cash, respectively. 81nidZpGqzkSDMpD
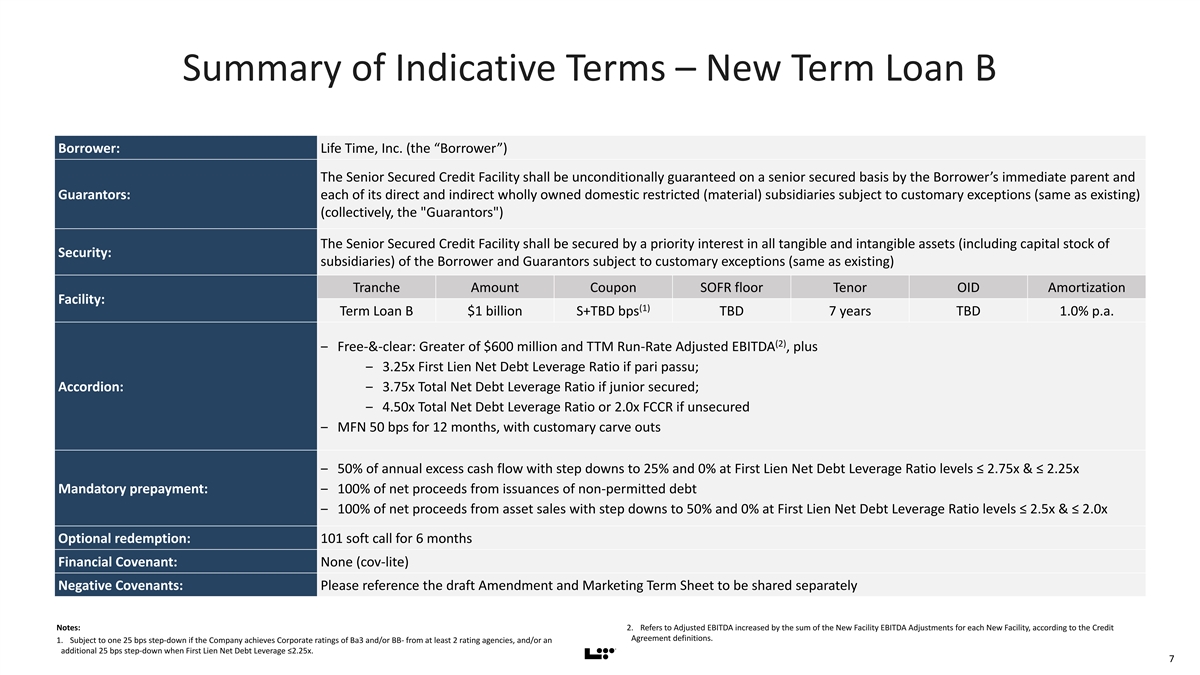
Summary of Indicative Terms – New Term Loan B Borrower: Life Time, Inc. (the “Borrower”) The Senior Secured Credit Facility shall be unconditionally guaranteed on a senior secured basis by the Borrower’s immediate parent and Guarantors: each of its direct and indirect wholly owned domestic restricted (material) subsidiaries subject to customary exceptions (same as existing) (collectively, the Guarantors ) The Senior Secured Credit Facility shall be secured by a priority interest in all tangible and intangible assets (including capital stock of Security: subsidiaries) of the Borrower and Guarantors subject to customary exceptions (same as existing) Tranche Amount Coupon SOFR floor Tenor OID Amortization Facility: (1) Term Loan B $1 billion S+TBD bps TBD 7 years TBD 1.0% p.a. (2) ‒ Free-&-clear: Greater of $600 million and TTM Run-Rate Adjusted EBITDA , plus ‒ 3.25x First Lien Net Debt Leverage Ratio if pari passu; Accordion: ‒ 3.75x Total Net Debt Leverage Ratio if junior secured; ‒ 4.50x Total Net Debt Leverage Ratio or 2.0x FCCR if unsecured ‒ MFN 50 bps for 12 months, with customary carve outs ‒ 50% of annual excess cash flow with step downs to 25% and 0% at First Lien Net Debt Leverage Ratio levels ≤ 2.75x & ≤ 2.25x Mandatory prepayment: ‒ 100% of net proceeds from issuances of non-permitted debt ‒ 100% of net proceeds from asset sales with step downs to 50% and 0% at First Lien Net Debt Leverage Ratio levels ≤ 2.5x & ≤ 2.0x Optional redemption: 101 soft call for 6 months Financial Covenant: None (cov-lite) Negative Covenants: Please reference the draft Amendment and Marketing Term Sheet to be shared separately Notes: 2. Refers to Adjusted EBITDA increased by the sum of the New Facility EBITDA Adjustments for each New Facility, according to the Credit Agreement definitions. 1. Subject to one 25 bps step-down if the Company achieves Corporate ratings of Ba3 and/or BB- from at least 2 rating agencies, and/or an additional 25 bps step-down when First Lien Net Debt Leverage ≤2.25x. 7 81nidZpGqzkSDMpD
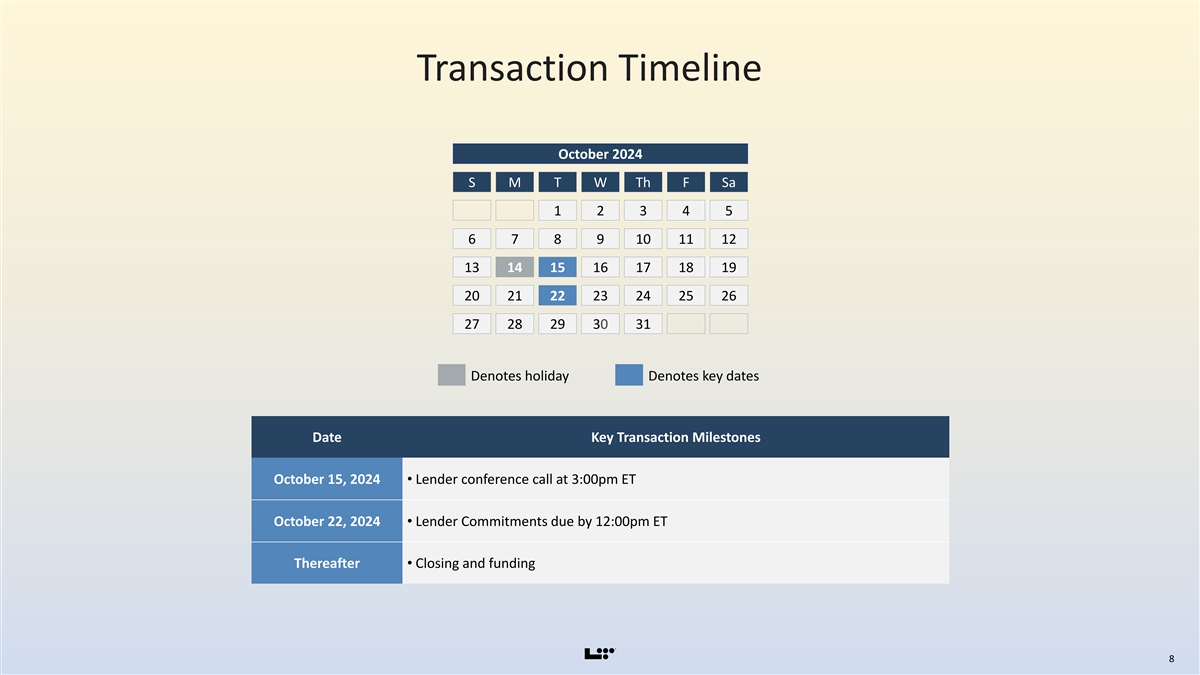
Transaction Timeline October 2024 S M T W Th F Sa 1 2 3 4 5 6 7 8 9 10 11 12 13 14 15 16 17 18 19 20 21 22 23 24 25 26 27 28 29 30 31 Denotes holiday Denotes key dates Date Key Transaction Milestones October 15, 2024• Lender conference call at 3:00pm ET October 22, 2024• Lender Commitments due by 12:00pm ET Thereafter • Closing and funding 8 81nidZpGqzkSDMpD

9
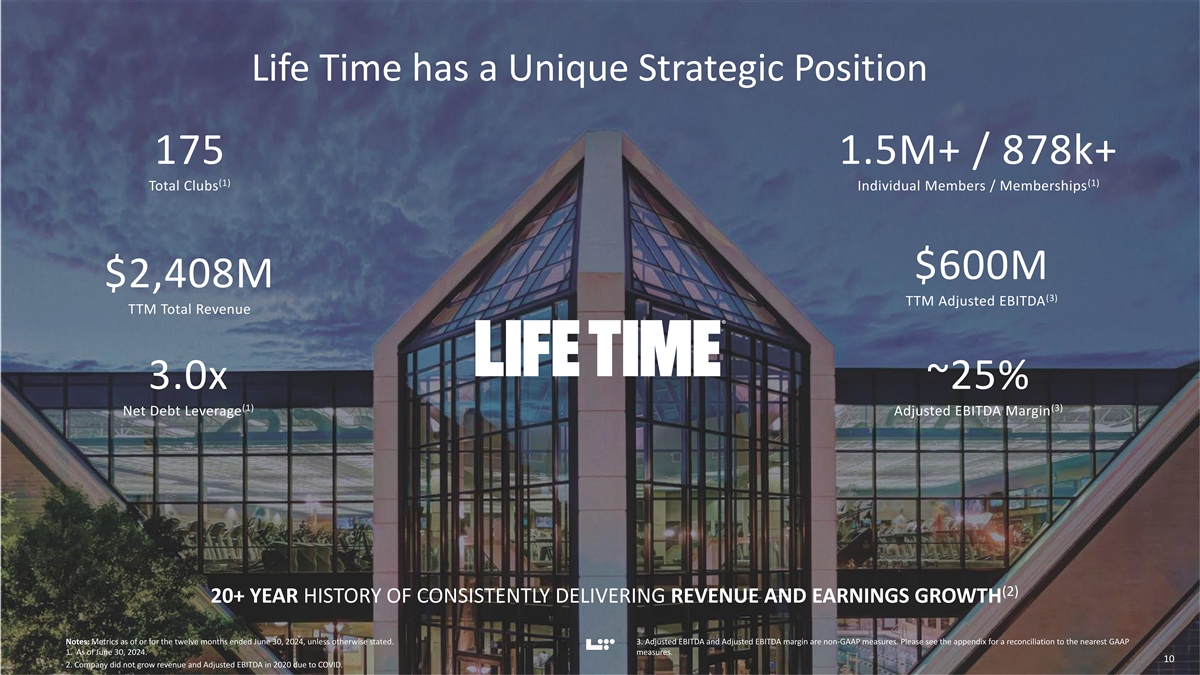
Life Time has a Unique Strategic Position 175 1.5M+ / 878k+ (1) (1) Total Clubs Individual Members / Memberships $600M $2,408M (3) TTM Adjusted EBITDA TTM Total Revenue 3.0x ~25% (1) (3) Net Debt Leverage Adjusted EBITDA Margin (2) 20+ YEAR HISTORY OF CONSISTENTLY DELIVERING REVENUE AND EARNINGS GROWTH Notes: Metrics as of or for the twelve months ended June 30, 2024, unless otherwise stated. 3. Adjusted EBITDA and Adjusted EBITDA margin are non-GAAP measures. Please see the appendix for a reconciliation to the nearest GAAP 1. As of June 30, 2024. measures. 10 10 2. Company did not grow revenue and Adjusted EBITDA in 2020 due to COVID. 81nidZpGqzkSDMpD
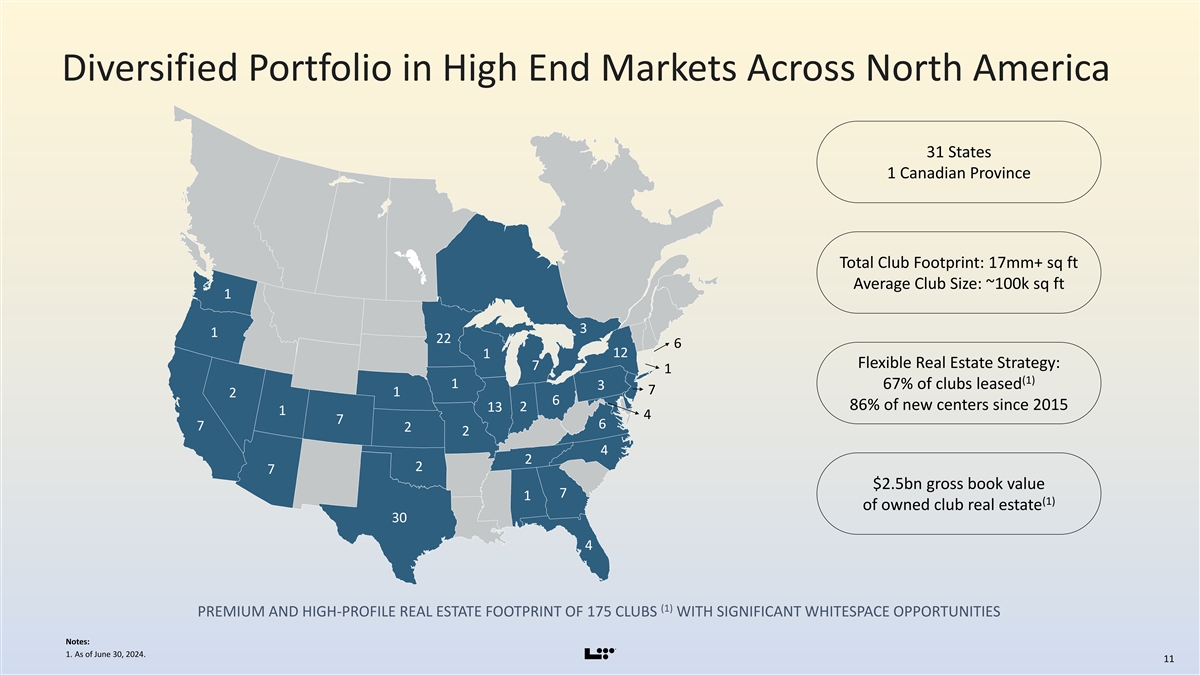
Diversified Portfolio in High End Markets Across North America 31 States 1 Canadian Province Total Club Footprint: 17mm+ sq ft Average Club Size: ~100k sq ft 1 3 1 22 6 12 1 Flexible Real Estate Strategy: 7 1 (1) 1 67% of clubs leased 3 7 1 2 6 86% of new centers since 2015 13 2 1 4 7 6 7 2 2 4 2 2 7 $2.5bn gross book value 7 1 (1) of owned club real estate 30 4 (1) PREMIUM AND HIGH-PROFILE REAL ESTATE FOOTPRINT OF 175 CLUBS WITH SIGNIFICANT WHITESPACE OPPORTUNITIES Notes: 1. As of June 30, 2024. 11 81nidZpGqzkSDMpD

(1) Large Addressable Health & Wellness Market ~$5.6 Trillion Global Market ~$1.9 Trillion North American Market S PA S & H E A LT H Y E AT I N G W O R K P L A C E W E L L N E S S O T H E R H E A LT H & F I T N E S S C L U B S P E R S O N A L I Z E D ( 2 ) A N D N U T R I T I O N W E L L N E S S R E A L E S TAT E W E L L N E S S V E R T I C A L S M E D I C I N E ~$976 ~$715 ~$1.1 ~$51 ~$398 ~$2.5 Billion Billion Trillion Billion Billion Trillion Notes: 2. Other Health & Wellness Verticals include Mental Wellness, Personal Care & Beauty, Thermal/Mineral Springs, Traditional & Complementary Medicine, and Wellness Tourism. 1. Global Wellness Institute 2023 Global Wellness Economy Monitor; data reflects 2022. 12 12 81nidZpGqzkSDMpD

13
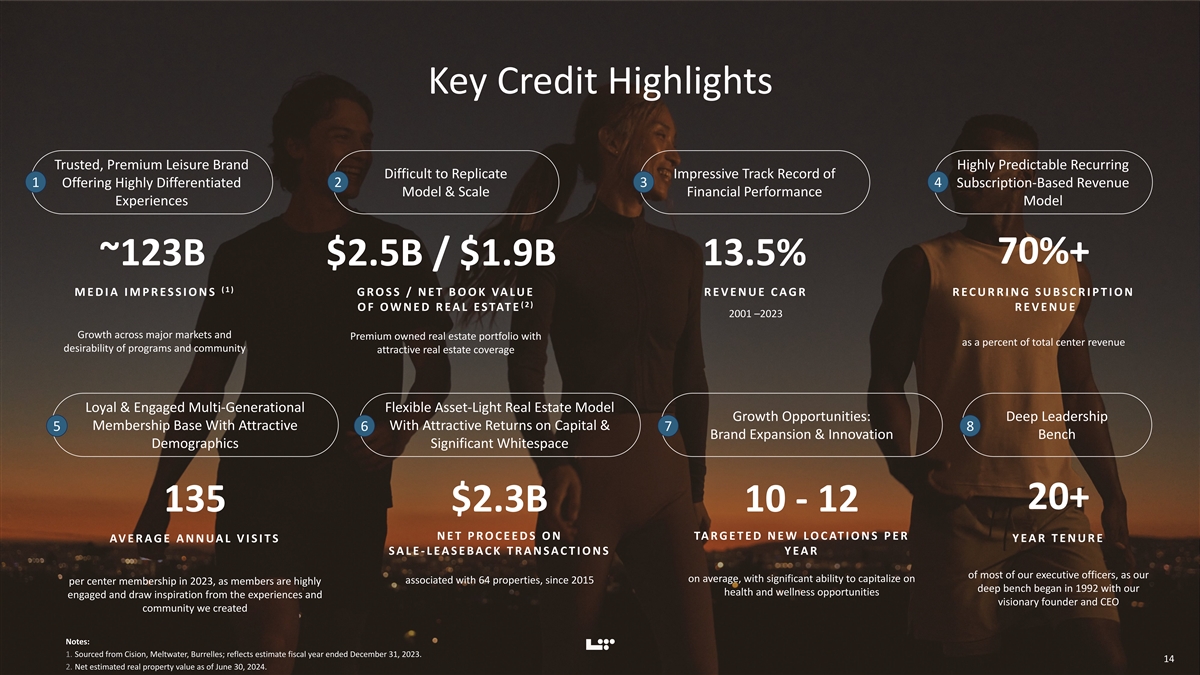
Key Credit Highlights Trusted, Premium Leisure Brand Highly Predictable Recurring Difficult to Replicate Impressive Track Record of 1 Offering Highly Differentiated 2 3 4 Subscription-Based Revenue Model & Scale Financial Performance Experiences Model 70%+ ~123B 13.5% $2.5B / $1.9B ( 1 ) M E D I A I M P R E S S I O N S G R O S S / N E T B O O K VA L U E R E V E N U E C A G R R E C U R R I N G S U B S C R I P T I O N ( 2 ) O F O W N E D R E A L E S TAT E R E V E N U E 2001 –2023 Growth across major markets and Premium owned real estate portfolio with as a percent of total center revenue desirability of programs and community attractive real estate coverage Loyal & Engaged Multi-Generational Flexible Asset-Light Real Estate Model Growth Opportunities: Deep Leadership Membership Base With Attractive With Attractive Returns on Capital & 5 6 7 8 Brand Expansion & Innovation Bench Demographics Significant Whitespace 20+ 135 $2.3B 10 - 12 N E T P R O C E E D S O N TA R G E T E D N E W L O C AT I O N S P E R Y E A R T E N U R E AV E R A G E A N N U A L V I S I T S S A L E - L E A S E B A C K T R A N S A C T I O N S Y E A R of most of our executive officers, as our on average, with significant ability to capitalize on associated with 64 properties, since 2015 per center membership in 2023, as members are highly deep bench began in 1992 with our health and wellness opportunities engaged and draw inspiration from the experiences and visionary founder and CEO community we created Notes: 1. Sourced from Cision, Meltwater, Burrelles; reflects estimate fiscal year ended December 31, 2023. 14 14 2. Net estimated real property value as of June 30, 2024. 81nidZpGqzkSDMpD
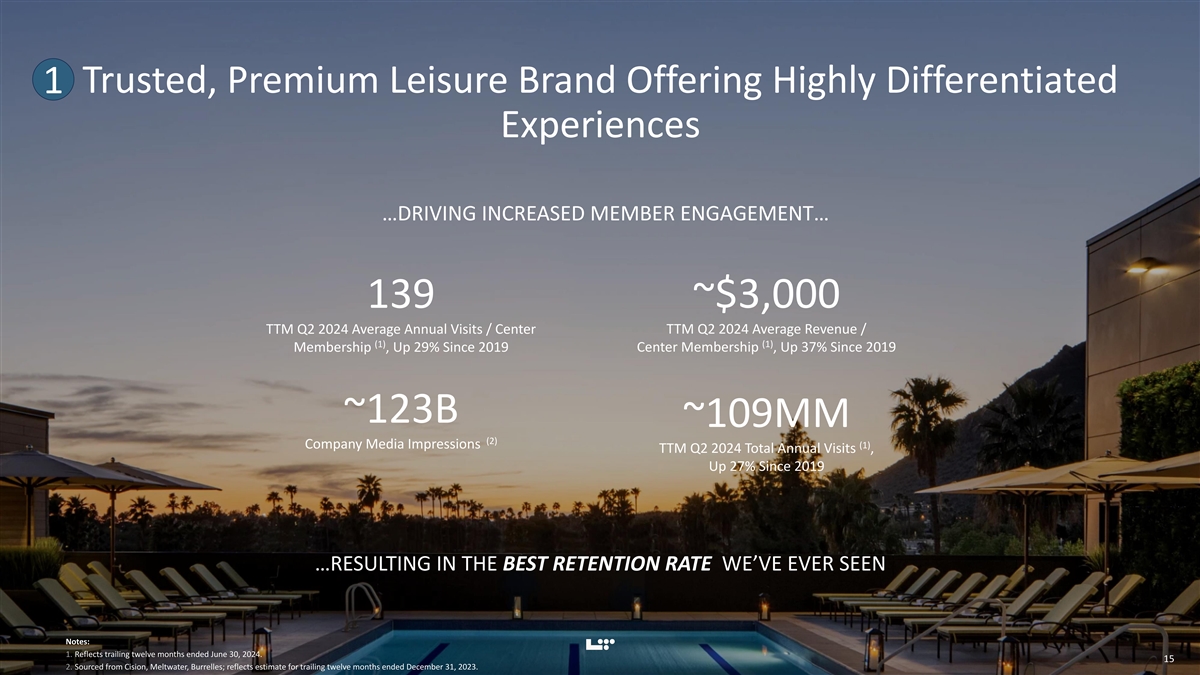
Trusted, Premium Leisure Brand Offering Highly Differentiated 1 Experiences …DRIVING INCREASED MEMBER ENGAGEMENT… 139 ~$3,000 TTM Q2 2024 Average Annual Visits / Center TTM Q2 2024 Average Revenue / (1) (1) Center Membership , Up 37% Since 2019 Membership , Up 29% Since 2019 ~123B ~109MM (2) Company Media Impressions (1) TTM Q2 2024 Total Annual Visits , Up 27% Since 2019 …RESULTING IN THE BEST RETENTION RATE WE’VE EVER SEEN Notes: 1. Reflects trailing twelve months ended June 30, 2024. 15 15 2. Sourced from Cision, Meltwater, Burrelles; reflects estimate for trailing twelve months ended December 31, 2023. 81nidZpGqzkSDMpD
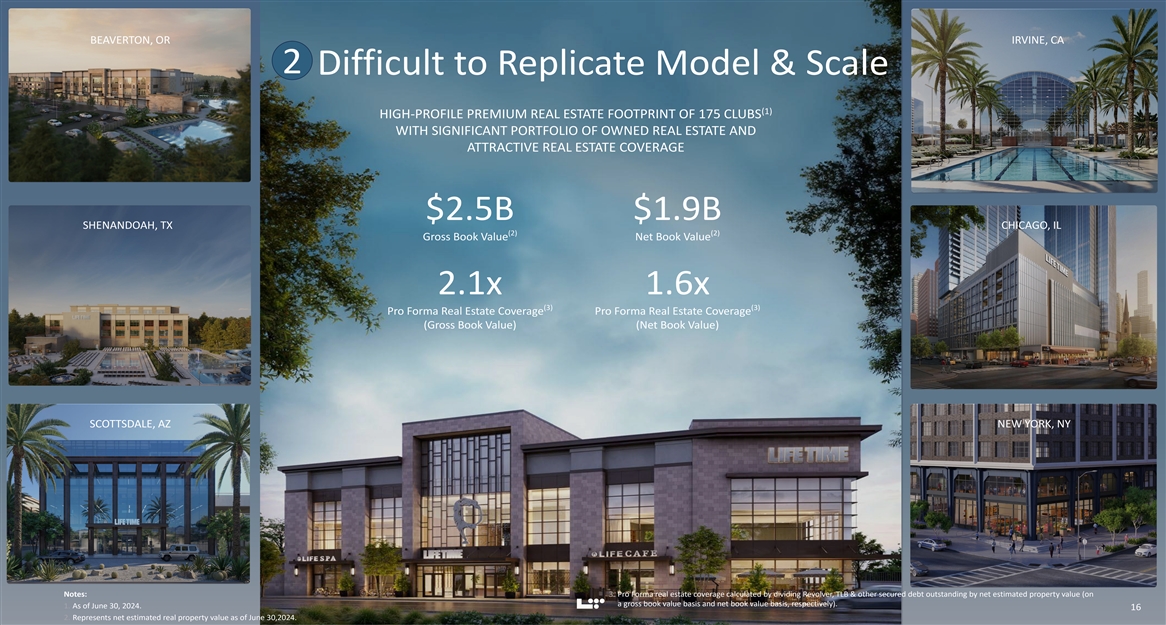
BEAVERTON, OR IRVINE, CA 2 Difficult to Replicate Model & Scale (1) HIGH-PROFILE PREMIUM REAL ESTATE FOOTPRINT OF 175 CLUBS WITH SIGNIFICANT PORTFOLIO OF OWNED REAL ESTATE AND ATTRACTIVE REAL ESTATE COVERAGE $2.5B $1.9B SHENANDOAH, TX CHICAGO, IL (2) (2) Gross Book Value Net Book Value 2.1x 1.6x (3) (3) Pro Forma Real Estate Coverage Pro Forma Real Estate Coverage (Gross Book Value) (Net Book Value) SCOTTSDALE, AZ NEW YORK, NY Notes: 3. Pro Forma real estate coverage calculated by dividing Revolver, TLB & other secured debt outstanding by net estimated property value (on a gross book value basis and net book value basis, respectively). 1. As of June 30, 2024. 16 16 2. Represents net estimated real property value as of June 30,2024. 81nidZpGqzkSDMpD
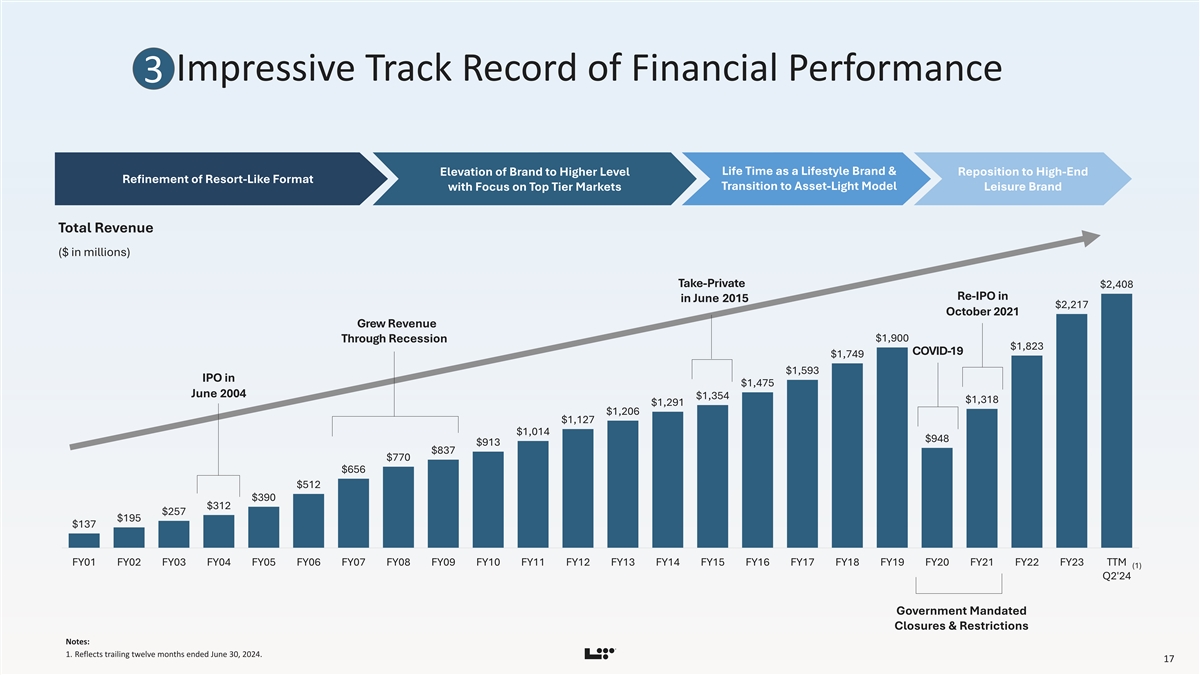
Impressive Track Record of Financial Performance 3 Life Time as a Lifestyle Brand & Elevation of Brand to Higher Level Reposition to High-End Refinement of Resort-Like Format Transition to Asset-Light Model with Focus on Top Tier Markets Leisure Brand Total Revenue ($ in millions) Take-Private $2,408 Re-IPO in in June 2015 $2,217 October 2021 Grew Revenue $1,900 Through Recession $1,823 COVID-19 $1,749 $1,593 IPO in $1,475 June 2004 $1,354 $1,318 $1,291 $1,206 $1,127 $1,014 $948 $913 $837 $770 $656 $512 $390 $312 $257 $195 $137 FY01 FY02 FY03 FY04 FY05 FY06 FY07 FY08 FY09 FY10 FY11 FY12 FY13 FY14 FY15 FY16 FY17 FY18 FY19 FY20 FY21 FY22 FY23 TTM (1) Q2'24 Government Mandated Closures & Restrictions Notes: 1. Reflects trailing twelve months ended June 30, 2024. 17 81nidZpGqzkSDMpD
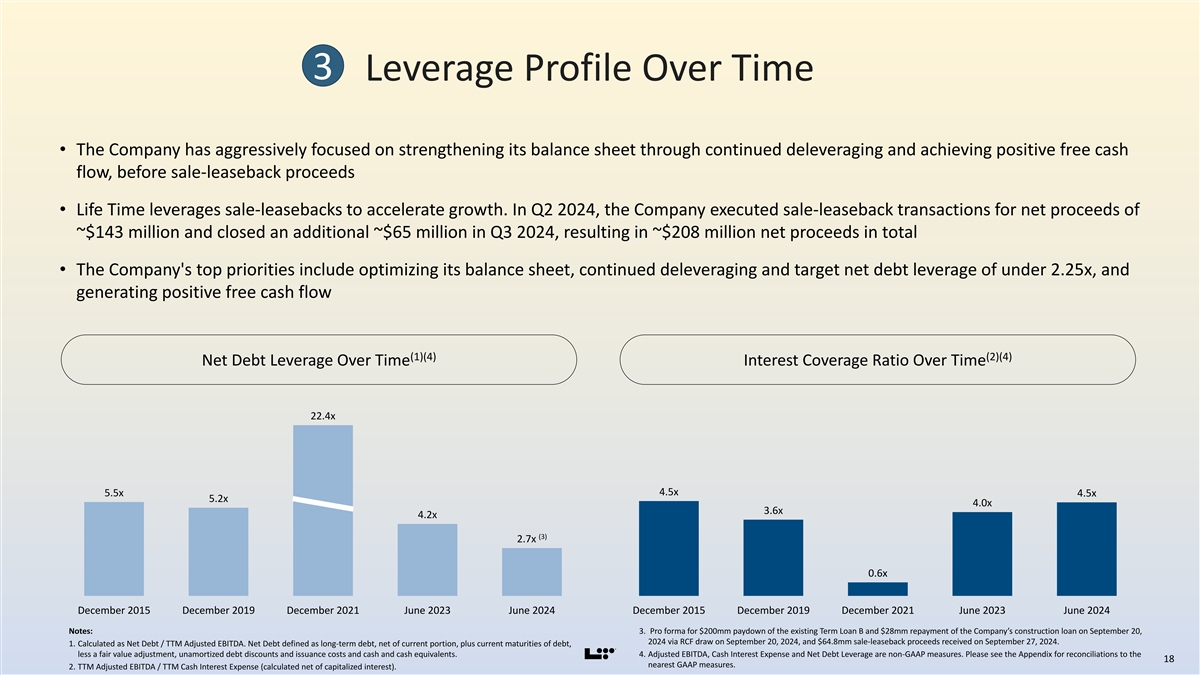
3 Leverage Profile Over Time • The Company has aggressively focused on strengthening its balance sheet through continued deleveraging and achieving positive free cash flow, before sale-leaseback proceeds • Life Time leverages sale-leasebacks to accelerate growth. In Q2 2024, the Company executed sale-leaseback transactions for net proceeds of ~$143 million and closed an additional ~$65 million in Q3 2024, resulting in ~$208 million net proceeds in total • The Company's top priorities include optimizing its balance sheet, continued deleveraging and target net debt leverage of under 2.25x, and generating positive free cash flow (1)(4) (2)(4) Net Debt Leverage Over Time Interest Coverage Ratio Over Time 22.4x 4.5x 5.5x 4.5x 5.2x 4.0x 3.6x 4.2x (3) 2.7x 0.6x December 2015 December 2019 December 2021 June 2023 June 2024 December 2015 December 2019 December 2021 June 2023 June 2024 Notes: 3. Pro forma for $200mm paydown of the existing Term Loan B and $28mm repayment of the Company’s construction loan on September 20, 2024 via RCF draw on September 20, 2024, and $64.8mm sale-leaseback proceeds received on September 27, 2024. 1. Calculated as Net Debt / TTM Adjusted EBITDA. Net Debt defined as long-term debt, net of current portion, plus current maturities of debt, less a fair value adjustment, unamortized debt discounts and issuance costs and cash and cash equivalents. 4. Adjusted EBITDA, Cash Interest Expense and Net Debt Leverage are non-GAAP measures. Please see the Appendix for reconciliations to the 18 nearest GAAP measures. 2. TTM Adjusted EBITDA / TTM Cash Interest Expense (calculated net of capitalized interest). 81nidZpGqzkSDMpD
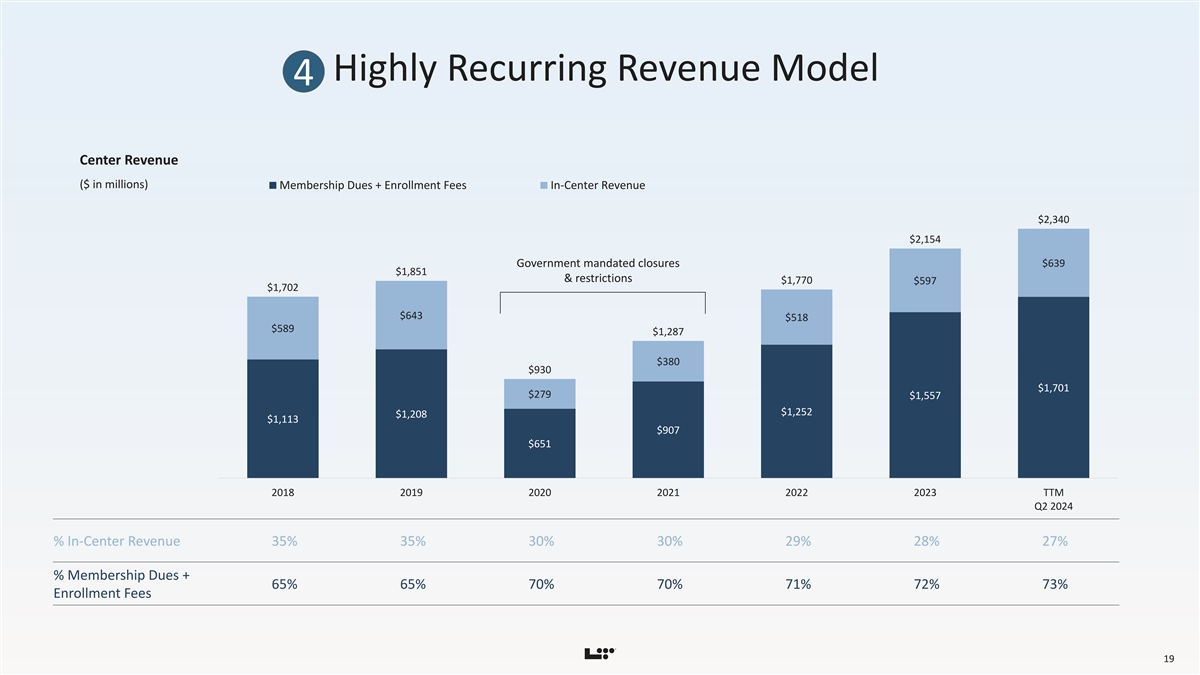
Highly Recurring Revenue Model 4 Center Revenue ($ in millions) Membership Dues + Enrollment Fees In-Center Revenue $2,340 $2,154 $639 Government mandated closures $1,851 & restrictions $1,770 $597 $1,702 $643 $518 $589 $1,287 $380 $930 $1,701 $279 $1,557 $1,252 $1,208 $1,113 $907 $651 2018 2019 2020 2021 2022 2023 TTM Q2 2024 % In-Center Revenue 35% 35% 30% 30% 29% 28% 27% % Membership Dues + 65% 65% 70% 70% 71% 72% 73% Enrollment Fees 19 81nidZpGqzkSDMpD
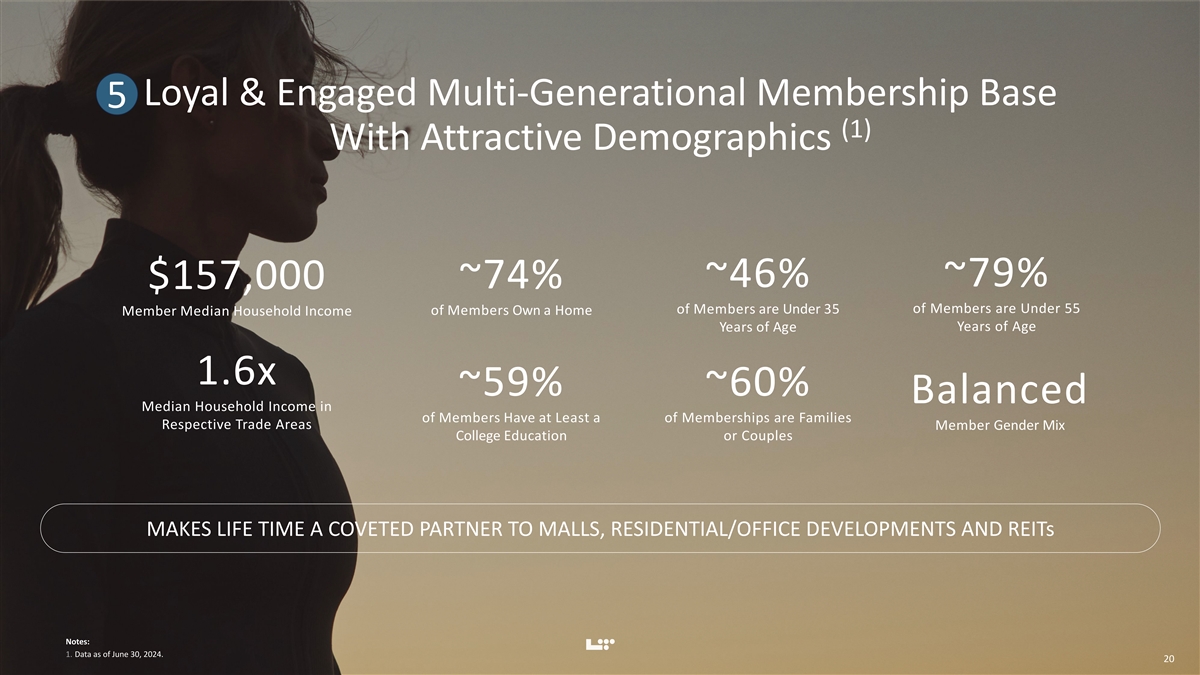
Loyal & Engaged Multi-Generational Membership Base 5 (1) With Attractive Demographics ~79% ~46% ~74% $157,000 of Members are Under 55 of Members are Under 35 of Members Own a Home Member Median Household Income Years of Age Years of Age 1.6x ~59% ~60% Balanced Median Household Income in of Members Have at Least a of Memberships are Families Respective Trade Areas Member Gender Mix College Education or Couples MAKES LIFE TIME A COVETED PARTNER TO MALLS, RESIDENTIAL/OFFICE DEVELOPMENTS AND REITs Notes: 1. Data as of June 30, 2024. 20 20 81nidZpGqzkSDMpD
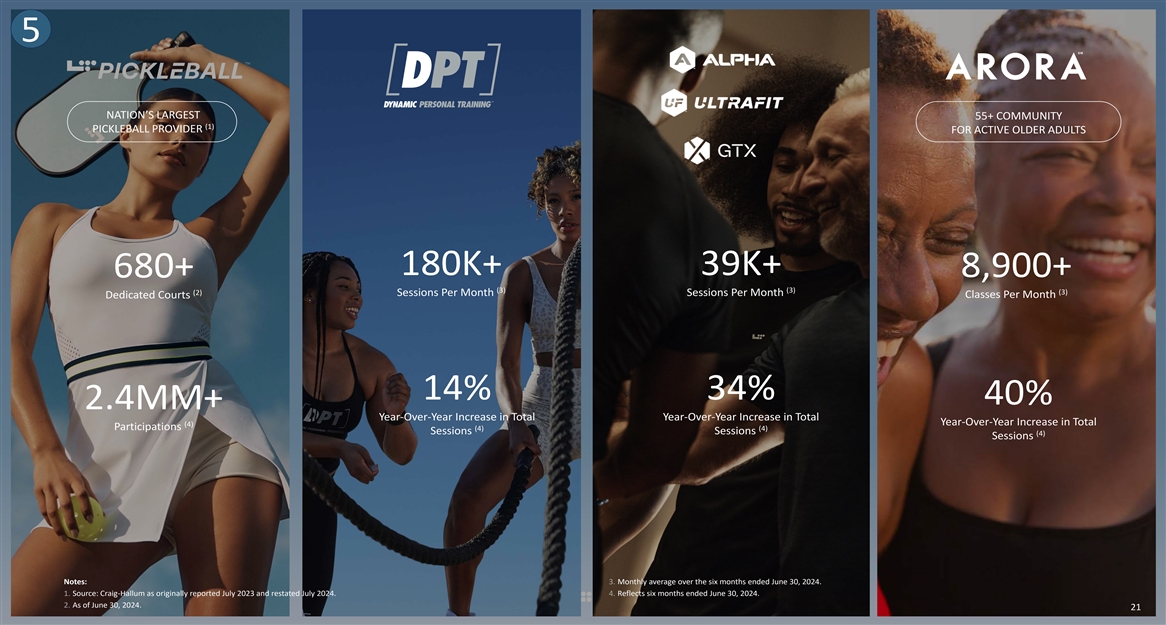
5 NATION’S LARGEST 55+ COMMUNITY (1) PICKLEBALL PROVIDER FOR ACTIVE OLDER ADULTS 180K+ 39K+ 8,900+ 680+ (3) (3) (2) (3) Sessions Per Month Sessions Per Month Dedicated Courts Classes Per Month 14% 34% 40% 2.4MM+ Year-Over-Year Increase in Total Year-Over-Year Increase in Total Year-Over-Year Increase in Total (4) Participations (4) (4) Sessions Sessions (4) Sessions Notes: 3. Monthly average over the six months ended June 30, 2024. 1. Source: Craig-Hallum as originally reported July 2023 and restated July 2024. 4. Reflects six months ended June 30, 2024. 2. As of June 30, 2024. 21 21 81nidZpGqzkSDMpD
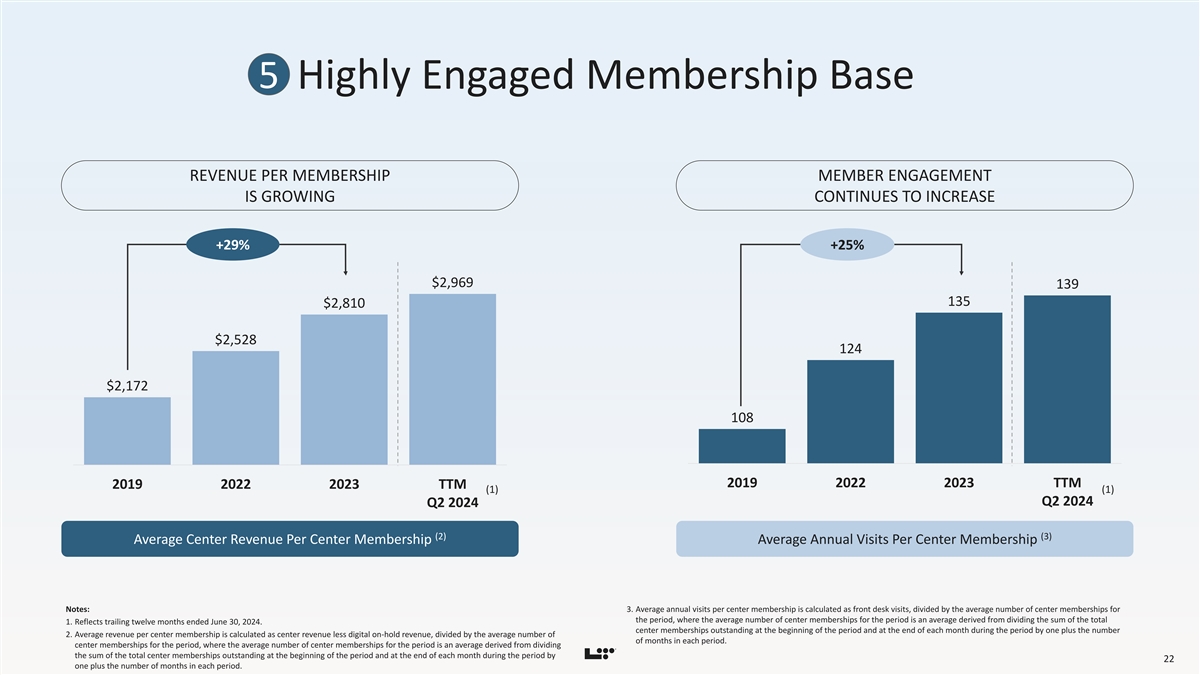
5 Highly Engaged Membership Base REVENUE PER MEMBERSHIP MEMBER ENGAGEMENT IS GROWING CONTINUES TO INCREASE +29% +25% $2,969 139 135 $2,810 $2,528 124 $2,172 108 2019 2022 2023 TTM 2019 2022 2023 TTM (1) (1) Q2 2024 Q2 2024 (2) (3) Average Center Revenue Per Center Membership Average Annual Visits Per Center Membership Notes: 3. Average annual visits per center membership is calculated as front desk visits, divided by the average number of center memberships for the period, where the average number of center memberships for the period is an average derived from dividing the sum of the total 1. Reflects trailing twelve months ended June 30, 2024. center memberships outstanding at the beginning of the period and at the end of each month during the period by one plus the number 2. Average revenue per center membership is calculated as center revenue less digital on-hold revenue, divided by the average number of of months in each period. center memberships for the period, where the average number of center memberships for the period is an average derived from dividing the sum of the total center memberships outstanding at the beginning of the period and at the end of each month during the period by 22 one plus the number of months in each period. 81nidZpGqzkSDMpD

Significant White Space Opportunities 6 Creating pathways to every market with healthy ROIC LAND & CONSTRUCTION CONTRIBUTIONS FROM: MALL OWNERS MULTI-FAMILY RESIDENTIAL DEVELOPERS OFFICE OWNERS/DEVELOPERS COMPETITOR TAKEOVERS GROUND-UP DEVELOPMENT 23 23 81nidZpGqzkSDMpD
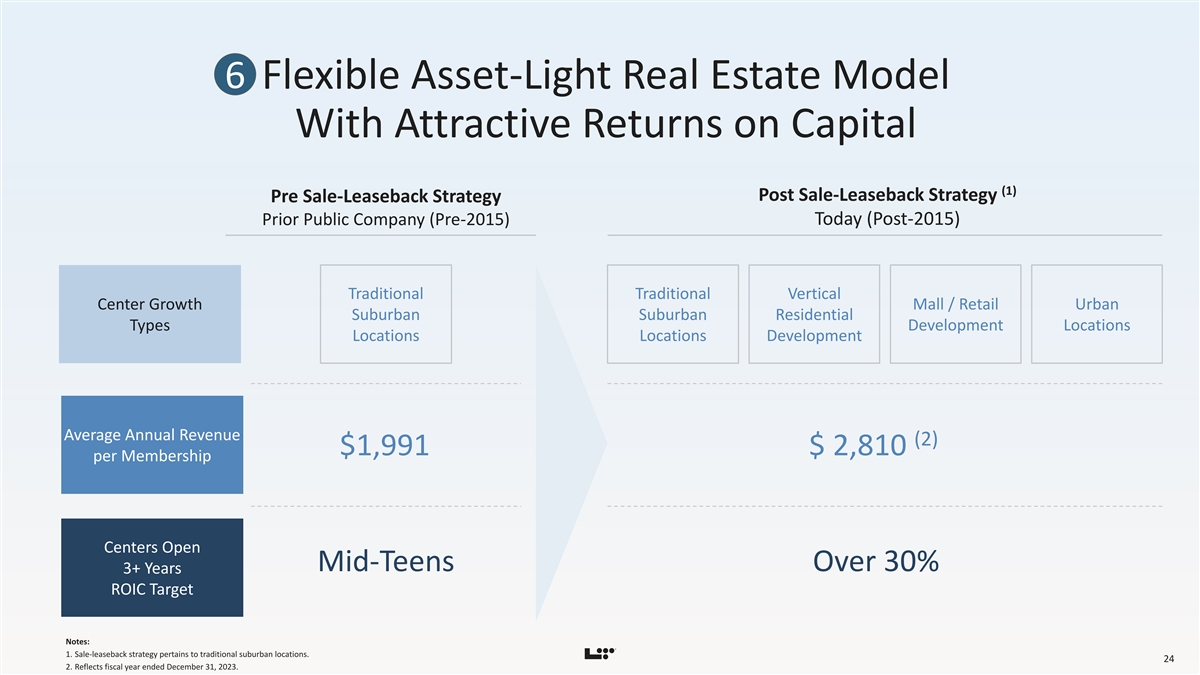
6 Flexible Asset-Light Real Estate Model With Attractive Returns on Capital (1) Post Sale-Leaseback Strategy Pre Sale-Leaseback Strategy Today (Post-2015) Prior Public Company (Pre-2015) Traditional Traditional Vertical Center Growth Mall / Retail Urban Suburban Suburban Residential Types Development Locations Locations Locations Development Average Annual Revenue (2) $1,991 $ 2,810 per Membership Centers Open Mid-Teens Over 30% 3+ Years ROIC Target Notes: 1. Sale-leaseback strategy pertains to traditional suburban locations. 24 2. Reflects fiscal year ended December 31, 2023. 81nidZpGqzkSDMpD

7 Additional Long-Term Growth Accelerators Through Brand Expansion & Innovation H O R M O N E S P E P T I D E S I V T H E R A P Y R E C O V E R Y R E J U V E N A T I O N S U P P L E M E N T A T I O N A E S T H E T I C S B O D Y W O R K 25 25 81nidZpGqzkSDMpD
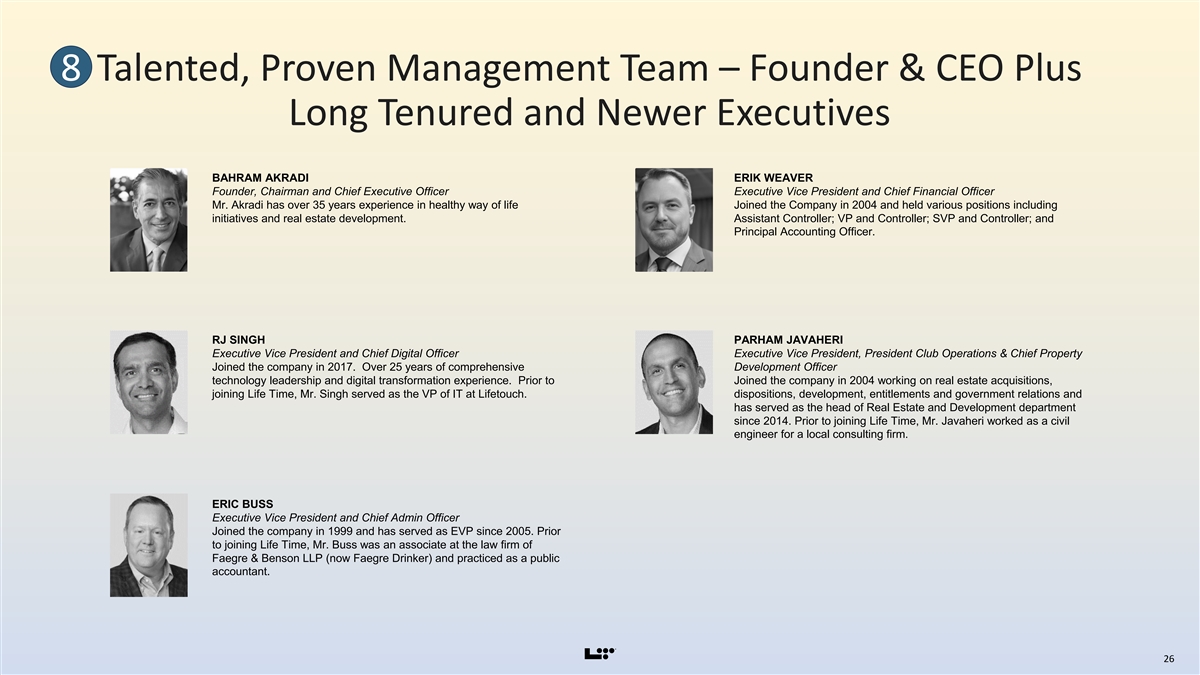
8 Talented, Proven Management Team – Founder & CEO Plus Long Tenured and Newer Executives BAHRAM AKRADI ERIK WEAVER Founder, Chairman and Chief Executive Officer Executive Vice President and Chief Financial Officer Mr. Akradi has over 35 years experience in healthy way of life Joined the Company in 2004 and held various positions including initiatives and real estate development. Assistant Controller; VP and Controller; SVP and Controller; and Principal Accounting Officer. RJ SINGH PARHAM JAVAHERI Executive Vice President and Chief Digital Officer Executive Vice President, President Club Operations & Chief Property Joined the company in 2017. Over 25 years of comprehensive Development Officer technology leadership and digital transformation experience. Prior to Joined the company in 2004 working on real estate acquisitions, joining Life Time, Mr. Singh served as the VP of IT at Lifetouch. dispositions, development, entitlements and government relations and has served as the head of Real Estate and Development department since 2014. Prior to joining Life Time, Mr. Javaheri worked as a civil engineer for a local consulting firm. ERIC BUSS Executive Vice President and Chief Admin Officer Joined the company in 1999 and has served as EVP since 2005. Prior to joining Life Time, Mr. Buss was an associate at the law firm of Faegre & Benson LLP (now Faegre Drinker) and practiced as a public accountant. 26 81nidZpGqzkSDMpD

8 Business Leaders Fartash Akradi Matthew Brinza Keith Dieruf Joe Gallagher John Griffith SVP of Life Time SVP, Architecture and SVP - Digital Marketing SVP, Corporate SVP, Real Estate and Technology Engineering Concierge and New Club Development Openings Matthew Heinrichs Bryan Janowiec Alicia Kockler Aaron Koehler Steven Larson Jr SVP, Technology SVP, Facility Operations SVP, Kids & Aquatics SVP - Real Estate and SVP, Club Operations Development James LaValle Mark Laylin Erik Lindseth Renee Main Lisa Pollock Chief Science Officer SVP, National Sales SVP, General Counsel SVP of Healthy Aging SVP, Human Resources and ARORA Kimo Seymour Jason Thunstrom Ali Yanez President, Media and SVP, Corporate SVP, LifeSpa Events Communications 27 81nidZpGqzkSDMpD

28
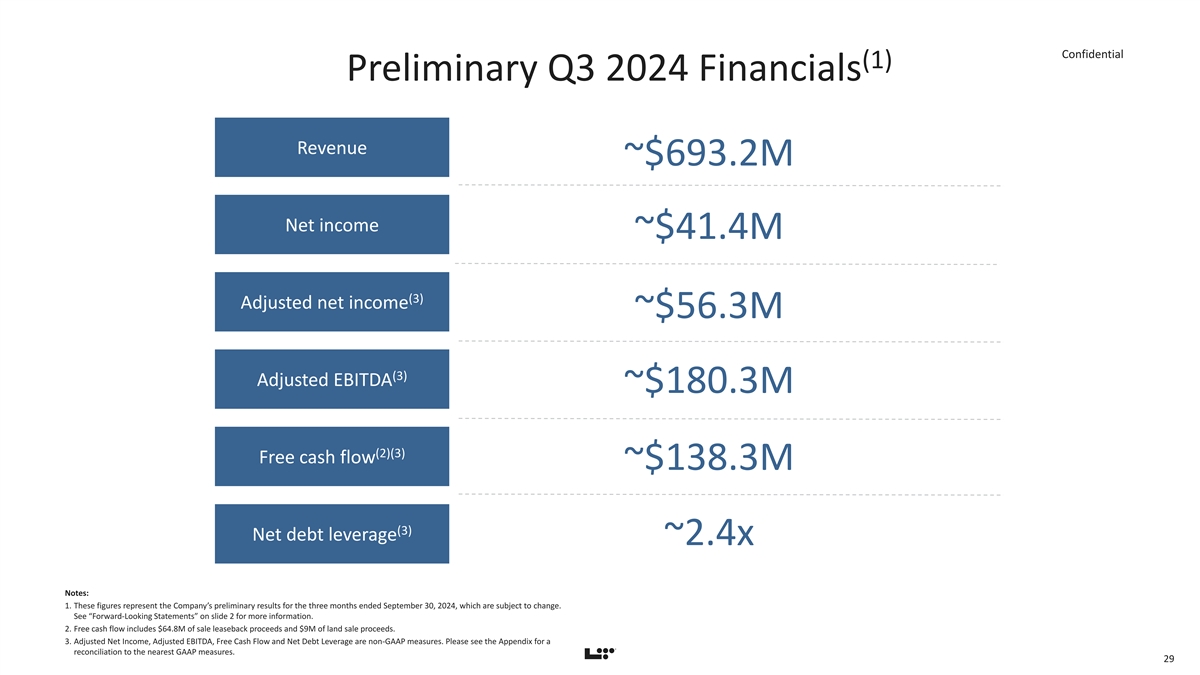
Confidential (1) Preliminary Q3 2024 Financials Revenue ~$693.2M Net income ~$41.4M (3) Adjusted net income ~$56.3M (3) Adjusted EBITDA ~$180.3M (2)(3) Free cash flow ~$138.3M (3) Net debt leverage ~2.4x Notes: 1. These figures represent the Company’s preliminary results for the three months ended September 30, 2024, which are subject to change. See “Forward-Looking Statements” on slide 2 for more information. 2. Free cash flow includes $64.8M of sale leaseback proceeds and $9M of land sale proceeds. 3. Adjusted Net Income, Adjusted EBITDA, Free Cash Flow and Net Debt Leverage are non-GAAP measures. Please see the Appendix for a reconciliation to the nearest GAAP measures. 29 81nidZpGqzkSDMpD
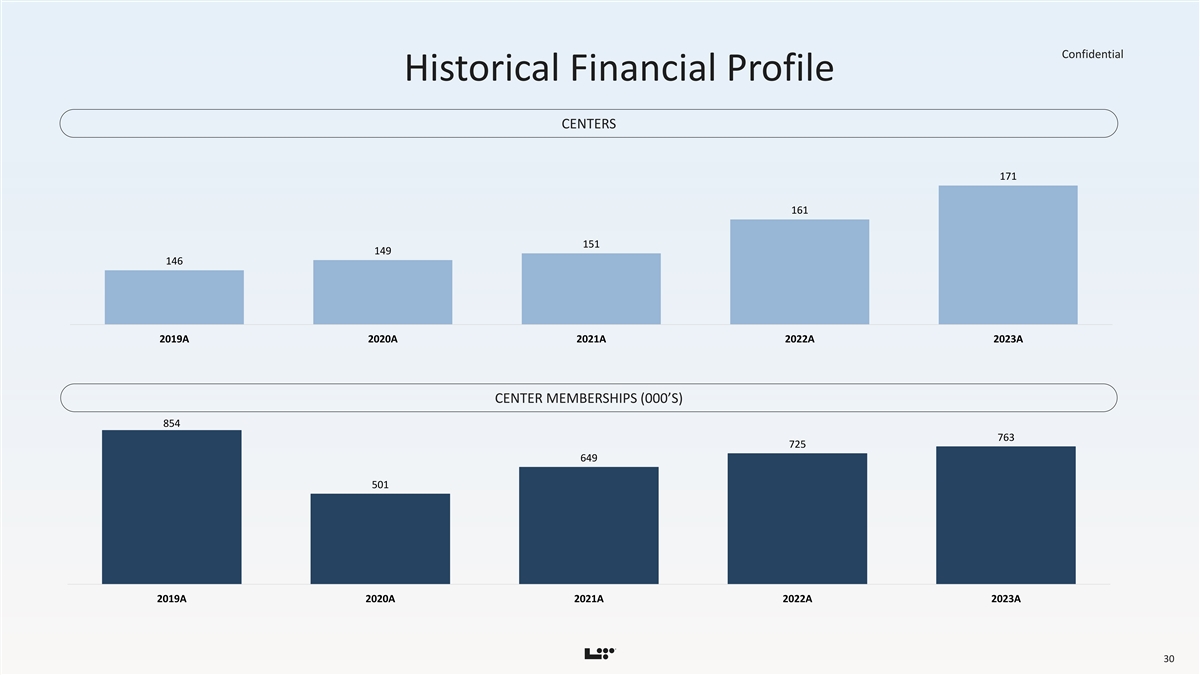
Confidential Historical Financial Profile CENTERS 171 161 151 149 146 2019A 2020A 2021A 2022A 2023A CENTER MEMBERSHIPS (000’S) 854 763 725 649 501 2019A 2020A 2021A 2022A 2023A 30 81nidZpGqzkSDMpD
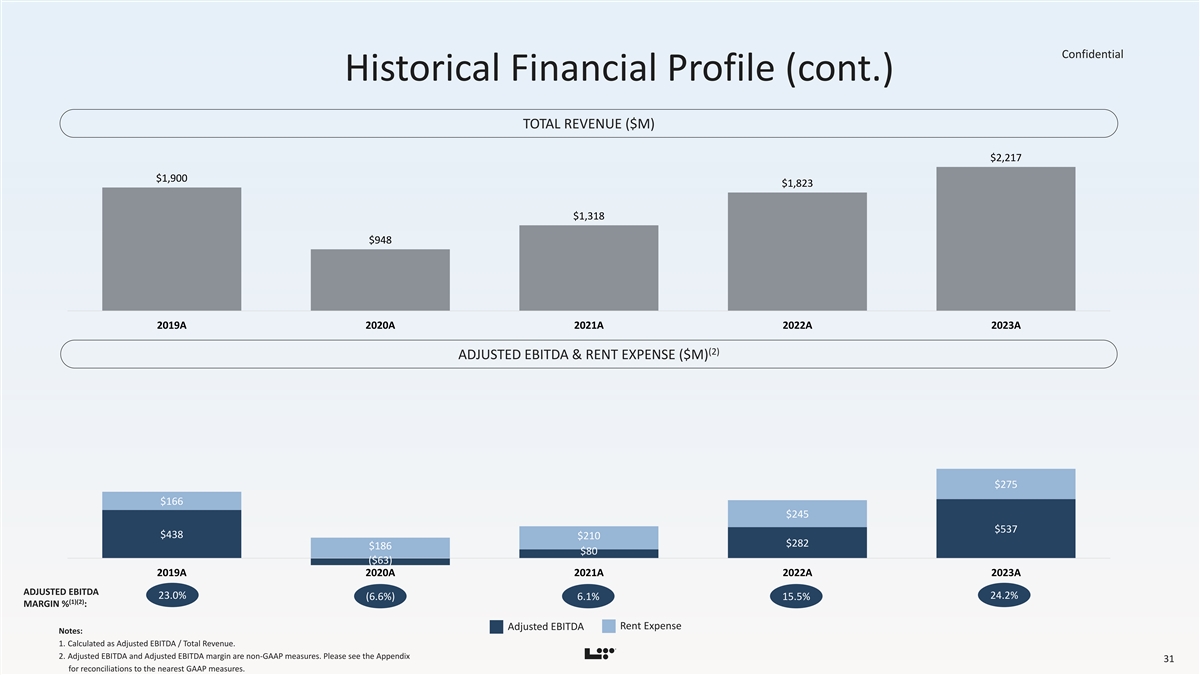
Confidential Historical Financial Profile (cont.) TOTAL REVENUE ($M) $2,217 $1,900 $1,823 $1,318 $948 2019A 2020A 2021A 2022A 2023A (2) ADJUSTED EBITDA & RENT EXPENSE ($M) $275 $166 $245 $537 $438 $210 $282 $186 $80 ($63) 2019A 2020A 2021A 2022A 2023A ADJUSTED EBITDA 23.0% 24.2% (6.6%) 6.1% 15.5% (1)(2) MARGIN % : Rent Expense Adjusted EBITDA Notes: 1. Calculated as Adjusted EBITDA / Total Revenue. 2. Adjusted EBITDA and Adjusted EBITDA margin are non-GAAP measures. Please see the Appendix 31 for reconciliations to the nearest GAAP measures. 81nidZpGqzkSDMpD
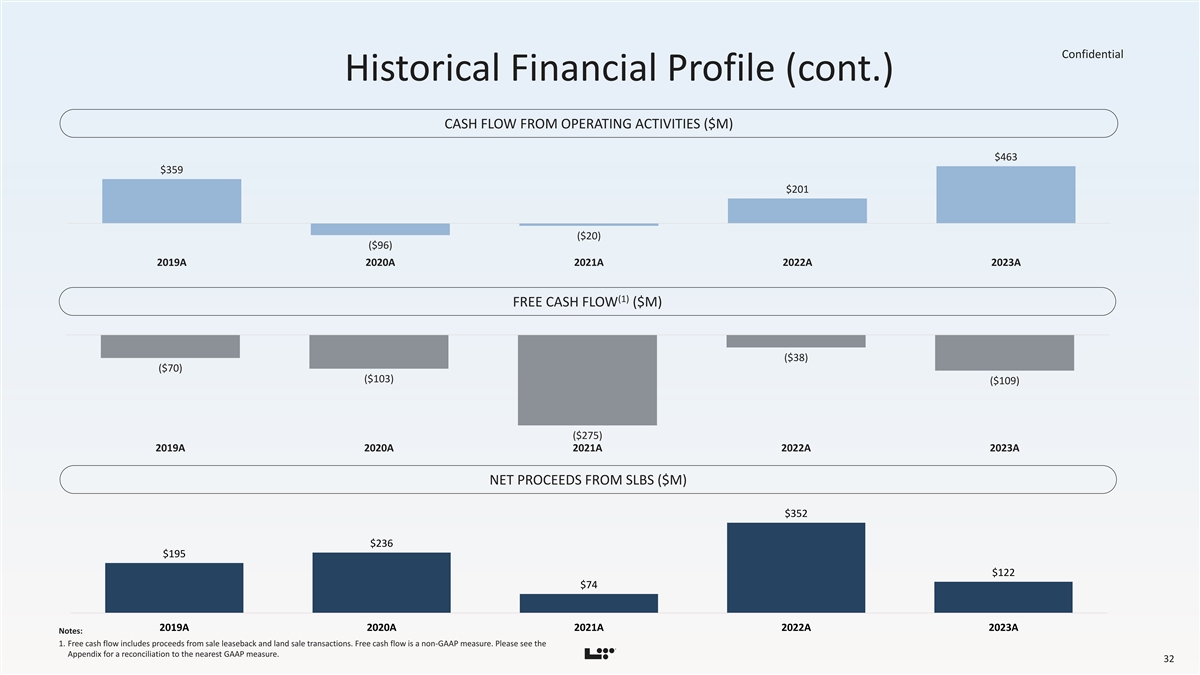
Confidential Historical Financial Profile (cont.) CASH FLOW FROM OPERATING ACTIVITIES ($M) $463 $359 $201 ($20) ($96) 2019A 2020A 2021A 2022A 2023A (1) FREE CASH FLOW ($M) ($38) ($70) ($103) ($109) ($275) 2019A 2020A 2021A 2022A 2023A NET PROCEEDS FROM SLBS ($M) $352 $236 $195 $122 $74 2019A 2020A 2021A 2022A 2023A Notes: 1. Free cash flow includes proceeds from sale leaseback and land sale transactions. Free cash flow is a non-GAAP measure. Please see the Appendix for a reconciliation to the nearest GAAP measure. 32 81nidZpGqzkSDMpD

33
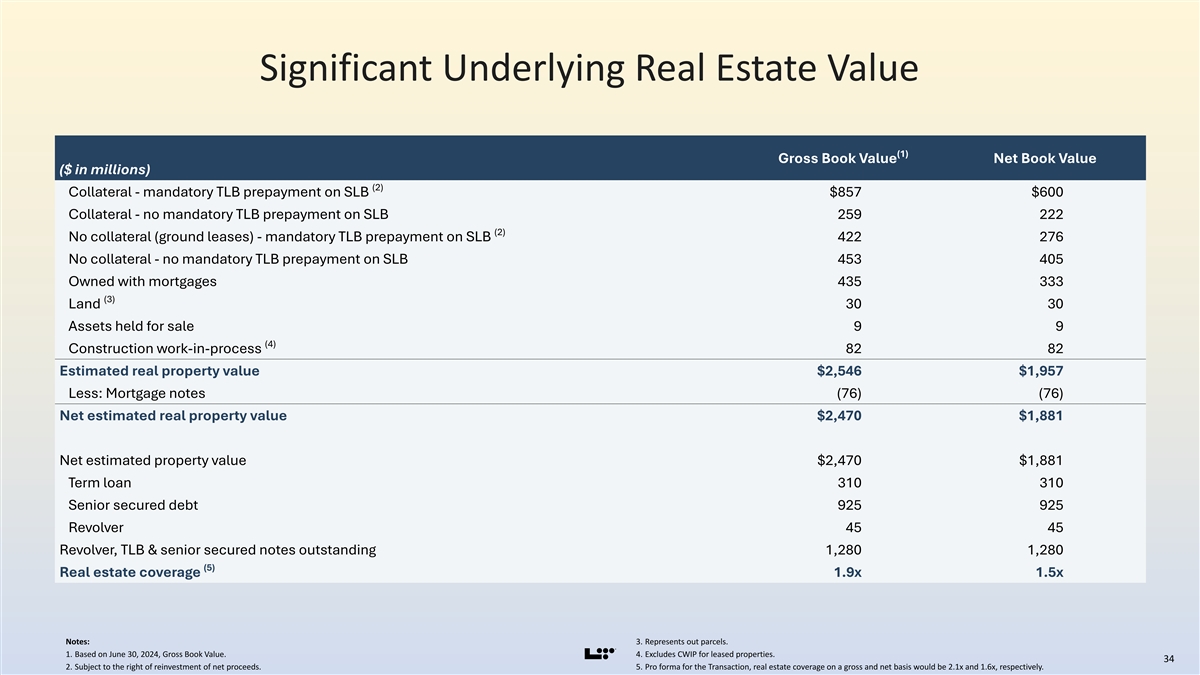
Significant Underlying Real Estate Value (1) Gross Book Value Net Book Value ($ in millions) (2) Collateral - mandatory TLB prepayment on SLB $857 $600 Collateral - no mandatory TLB prepayment on SLB 259 222 (2) No collateral (ground leases) - mandatory TLB prepayment on SLB 422 276 No collateral - no mandatory TLB prepayment on SLB 453 405 Owned with mortgages 435 333 (3) Land 30 30 Assets held for sale 9 9 (4) Construction work-in-process 82 82 Estimated real property value $2,546 $1,957 Less: Mortgage notes (76) (76) Net estimated real property value $2,470 $1,881 Net estimated property value $2,470 $1,881 Term loan 310 310 Senior secured debt 925 925 Revolver 45 45 Revolver, TLB & senior secured notes outstanding 1,280 1,280 (5) Real estate coverage 1.9x 1.5x Notes: 3. Represents out parcels. 1. Based on June 30, 2024, Gross Book Value. 4. Excludes CWIP for leased properties. 34 2. Subject to the right of reinvestment of net proceeds. 5. Pro forma for the Transaction, real estate coverage on a gross and net basis would be 2.1x and 1.6x, respectively. 81nidZpGqzkSDMpD
Reconciliation of Net Income (Loss) to Adjusted EBITDA Fiscal Year Ended TTM Q3 Adjustment detail (1) (1) 1. Share-based compensation expense is associated with stock options, restricted ($ in millions) Dec-15 Dec-19 Dec-20 Dec-21 Dec-22 Dec-23 Jun-23 Jun-24 Sep-24 Sep-24 1 stock units, performance stock units, Life Time’s employee stock purchase plan (“ESPP”) that launched on December 1, 2022 and liability classified awards Net income (loss) ($43) $30 ($360) ($579) ($2) $76 $83 $109 $143 $41 related to short-term incentive plans. A significant portion of the share-based Interest expense, net of interest compensation expense that the Company recognized during the fiscal year 108 129 128 225 114 131 120 143 146 36 income ended December 31, 2021 is associated with stock options that were granted prior to 2021. Provision for (benefit from) income (19) 10 (128) (140) (1) 19 18 30 40 16 taxes 2. Represents the net incremental expenses (credits) recognized related to the 2 COVID-19 pandemic. For FY2023, primarily consisted of legal-related costs in Depreciation and amortization 163 220 248 235 229 244 230 264 269 69 pursuit of the Company’s claim against Zurich, partially offset by a subsidy for its 1 Canadian operations. For FY2022, primarily consisted of site development cost Share-based compensation expense 6 24 -- 334 37 50 32 47 44 12 write-offs and legal-related costs in pursuit of its claim against Zurich. For 2 FY2020, primarily consisted of the recovery of certain qualifying expenses under COVID-19 related expenses (credits) -- -- 49 (2) 3 0 3 0 -- -- the CARES Act, partially offset by COVID-19 legal-related costs in pursuit of its Loss (gain) on sale-leaseback claim against Zurich. 3 -- (0) (7) 2 (98) 14 (47) 5 (2) 5 transactions 3 3. Adjustment for the impact of (gains) losses on the sale-leaseback of Life Time’s 4 Capital transaction costs -- 6 0 3 0 -- -- -- -- -- properties as they do not reflect costs associated with ongoing operations. 5 4. Represents one-time costs related to capital transactions, including debt and Legal (recoveries) settlements -- 8 0 (0) -- -- -- -- 1 1 4 equity offerings that are non-recurring in nature but excluding direct costs related to the Company’s IPO which were netted against the proceeds of the Asset impairments -- 10 7 -- -- 7 1 5 -- -- 6 IPO. Transaction related expenses -- -- -- -- -- -- -- 112 -- -- 7 5. Life Time adjusts for the impact of unusual legal settlements paid or recoveries 5 received. These are non-recurring in nature and do not reflect costs associated Non-recurring items 38 -- -- -- -- -- -- -- -- -- 8 with our normal ongoing operations. Other -- 1 0 2 0 (4) (6) (3) (3) 0 9 6. Represents non-cash asset impairments of Life Time’s long-lived and intangible 6 assets. Adjusted EBITDA $365 $438 ($63) $80 $282 $537 $434 $600 $638 $180 7. Includes expenses related to the acquisition of Life Time and other non-recurring 7 Total Revenue $1,900 $948 $1,318 $1,823 $2,217 $2,042 $2,408 $1,354 $2,517 $693 charges. (2) Adjusted EBITDA Margin 27.0% 23.0% (6.6%) 6.1% 15.5% 24.2% 21.2% 24.9% 25.3% 26.0% 8 8. Includes expenses that are one-time and non-recurring. 9. Includes (i) (gain) loss on sales of land of $(4) million and $(5) million for the Rent $71 $166 $186 $210 $245 $275 $263 $288 $298 $79 9 twelve months ended June 30, 2024 and September 30, 2024, respectively, (ii) (gain) loss on sales of the Company’s triathlons and certain other assets of $(5) Notes: million, $(7) million and $1 million for the twelve months ended December 31, 1. These figures represent the Company’s preliminary results for the three months or twelve months ended September 30, 2024, which are subject 2023, June 30, 2023 and September 30, 2024, respectively, and (iii) large to change. See “Forward-Looking Statements” on slide 2 for more information. corporate restructuring charges and executive level involuntary terminations of 2. Adjusted EBITDA Margin calculated as TTM Adjusted EBITDA divided by TTM Total Revenue. $1 million for each of the twelve months ended December 31, 2023, June 30, 35 2023, June 30, 2024 and September 30, 2024. 81nidZpGqzkSDMpD
Reconciliation of Total Debt to Net Debt Leverage (1) 2015 2019 2021 2022 2023 Q2 2023 Q2 2024 Q3 2024 ($ in millions) Current maturities of debt $30 $36 $23 $15 $74 $65 $13 $12 Long-term debt, net of current portion $1,926 $2,224 $1,776 $1,806 $1,859 $1,792 $1,830 $1,640 Total Debt $1,956 $2,260 $1,799 $1,821 $1,933 $1,857 $1,843 $1,652 Less: Fair value adjustment $6 $3 $2 $1 $1 $1 $0 $0 Less: Unamortized debt discounts and issuance ($68) ($30) ($26) ($19) ($15) ($18) ($12) ($6) costs (2) Less: Cash and cash equivalents $10 $26 $26 $15 $11 $16 $35 $121 Net Debt $2,008 $2,261 $1,797 $1,824 $1,936 $1,858 $1,820 $1,537 (3) (3) (3) TTM Adjusted EBITDA $365 $438 $80 $282 $537 $434 $600 $638 Net Debt Leverage 5.5x 5.2x 22.4x 6.5x 3.6x 4.2x 3.0x 2.4x Notes: 1. These figures represent the Company’s preliminary results for the three months ended September 30, 2024, which are subject to change. See “Forward-Looking Statements” on slide 2 for more information. 2. Cash and cash equivalents exclude restricted cash of $22M for 2019, $6M for 2021, $10M for 2022, $19M for 2023, and $15M for Q2 2023. 36 3. TTM Adjusted EBITDA reflects trailing twelve months for Q2 2023, Q2 2024, and Q3 2024 respectively. 81nidZpGqzkSDMpD
Reconciliation of Cash Flow from Operating Activities to Free Cash Flow (1) 2019 2020 2021 2022 2023 Q3 2024 ($ in millions) Net cash flow provided by operating activities $359 ($96) ($20) $201 $463 $151 Capital expenditures, net of construction ($624) ($266) ($329) ($591) ($698) ($87) reimbursements Proceeds from sale-leaseback transactions $195 $236 $74 $352 $122 $65 Proceeds from land sales $- $23 $- $- $4 $9 ($70) ($103) ($275) ($38) ($109) $138 Free Cash Flow Notes: 1. These figures represent the Company’s preliminary results for the three months ended September 30, 2024, which are subject to change. See “Forward-Looking Statements” on slide 2 for more information. 37 81nidZpGqzkSDMpD
Reconciliation of Interest Coverage Ratio Fiscal Year Ended TTM Dec-15 Dec-19 Dec-21 Jun-23 Jun-24 ($ in millions) Interest expense, net of interest income $108 $131 $225 $120 $144 Less: Accrued interest (non-cash) (14) 1 (21) (4) (2) Less: Debt issuance cost amortization (13) (11) (27) (7) (7) Less: Debt issuance cost written off associated with debt refinance -- -- (10) -- -- Less: Loss on extinguishment of Sponsor loan -- -- (41) -- -- Less: Interest accretion of finance lease liabilities -- (0) -- (0) (0) Total Cash Interest Expense $81 $121 $125 $109 $135 (1) (1) TTM Adjusted EBITDA $365 $438 $80 $434 $600 Interest Coverage Ratio 4.5x 3.6x 0.6x 4.0x 4.5x Notes: 1. TTM Adjusted EBITDA reflects trailing twelve months for Q2 2023 and Q2 2024, respectively. 38 81nidZpGqzkSDMpD