EX-99.1
Published on May 1, 2023
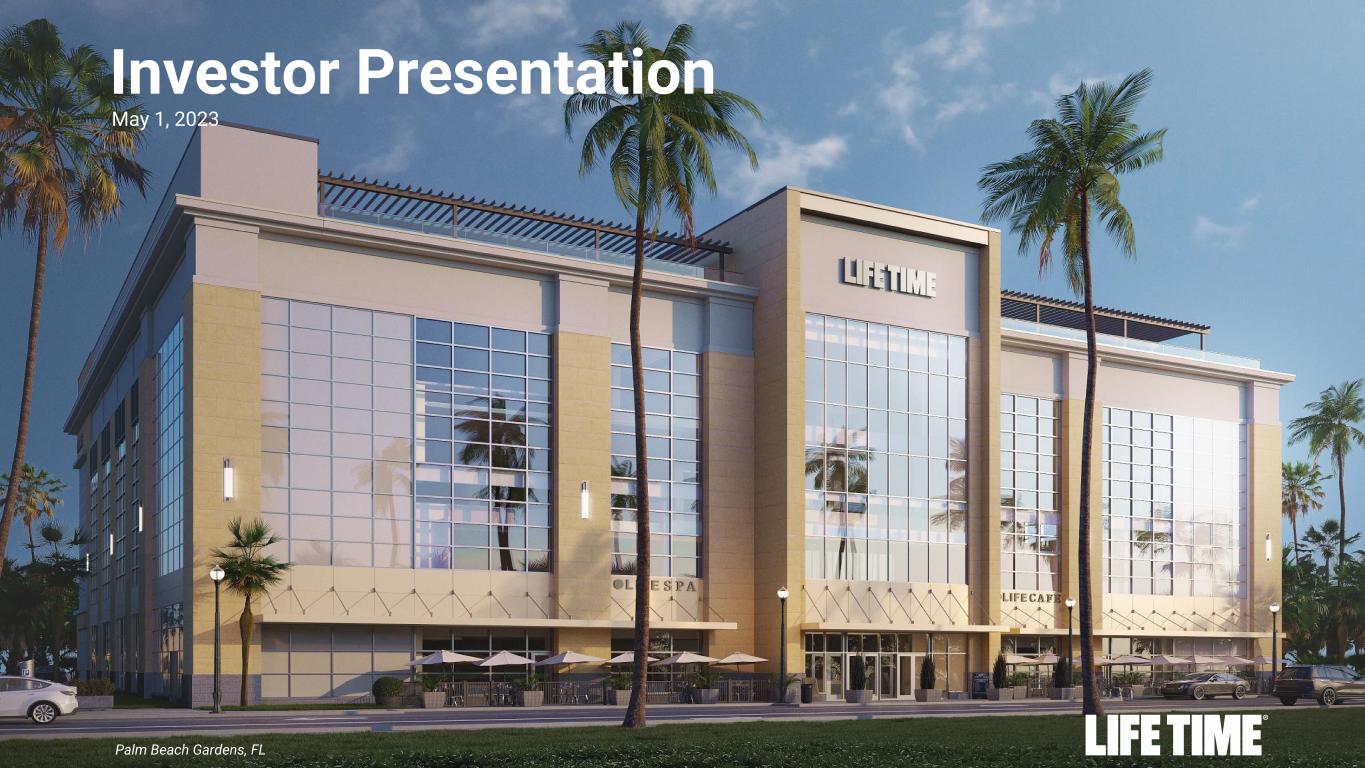
1Presentation title in footer Palm Beach Gardens, FL Investor Presentation May 1, 2023
2 Legal Disclaimer Forward-Looking Statements This presentation includes “forward-looking statements” within the meaning of federal securities regulations. Forward-looking statements in this presentation include, but are not limited to, the plans, strategies and prospects, both business and financial, of Life Time Group Holdings, Inc. (“we,” “us” or the “Company”), including its financial outlook for the full fiscal year 2023, opportunities for reduced net debt and leverage, future performance and opportunities for growth and margin expansion, investment strategy, consumer demand, industry and economic trends, and future performance. These statements are based on the beliefs and assumptions of the Company’s management. Forward-looking statements are inherently subject to risks, uncertainties and assumptions. Generally, statements that are not historical facts, including statements concerning the Company’s possible or assumed future actions, business strategies, events or results of operations, are forward-looking statements. These statements may be preceded by, followed by or include the words “believe,” “expect,” “anticipate,” “intend,” “plan,” “estimate” or similar expressions. In addition, any statements or information that refer to expectations, beliefs, plans, projections, objectives, performance or other characterizations of future events or circumstances, including any underlying assumptions, are forward-looking. Factors that could cause actual results to differ materially from those forward-looking statements included in this presentation include, but are not limited to, risks relating to our business operations and competitive and economic environment, risks relating to our brand, risks relating to the growth of our business, risks relating to our technological operations, risks relating to our capital structure and lease obligations, risks relating to our human capital, risks relating to legal compliance and risk management, and risks relating to ownership of our common stock and the other important factors discussed under the caption “Risk Factors” in the Company’s Annual Report on Form 10-K for the year ended December 31, 2022, filed with the Securities and Exchange Commission (the “SEC”) on March 8, 2023 (File No. 001-40887), as such factors may be updated from time to time in the Company’s other filings with the SEC, which are accessible on the SEC’s website at www.sec.gov. These and other important factors could cause actual results to differ materially from those indicated by the forward-looking statements made in this presentation. Any forward-looking statement that the Company makes in this presentation speaks only as of the date of such statement. Except as required by law, the Company does not have any obligation to update or revise, or to publicly announce any update or revision to, any of the forward-looking statements, whether as a result of new information, future events or otherwise. Non-GAAP Financial Measure This presentation includes Adjusted EBITDA and Net Debt and calculations in connection therewith, which are not presented in accordance with the generally accepted accounting principles in the United States (“GAAP”). These non-GAAP financial measures are not based on any comprehensive set of accounting rules or principles and should be considered in addition to, and not as a substitute for or superior to, net income (loss) or total debt (defined as long-term debt, net of current portion, plus current maturities of debt), less a fair value adjustment, unamortized debt discounts and issuance costs and cash and cash equivalents, respectively, as a measure of financial performance or any other performance measure derived in accordance with GAAP, and should not be construed as an inference that the Company’s future results will be unaffected by unusual or non- recurring items. In addition, these non-GAAP financial measures should be read in conjunction with the Company’s financial statements prepared in accordance with GAAP. The reconciliation of the Company’s non-GAAP financial measures to the corresponding GAAP measures should be carefully evaluated. Please note that the Company has not provided the most directly comparable GAAP financial measure, or a quantitative reconciliation thereto, for the Adjusted EBITDA forward-looking guidance for full year 2023 included in this presentation in reliance on the unreasonable efforts exception provided under Item 10(e)(1)(i)(B) of Regulation S-K. Providing the most directly comparable GAAP financial measure, or a quantitative reconciliation thereto, cannot be done without unreasonable effort due to the inherent uncertainty and difficulty in predicting certain non-cash, material and/or non-recurring expenses or benefits; legal settlements or other matters; and certain tax positions. The variability of these items could have an unpredictable, and potentially significant, impact on our future GAAP financial results.
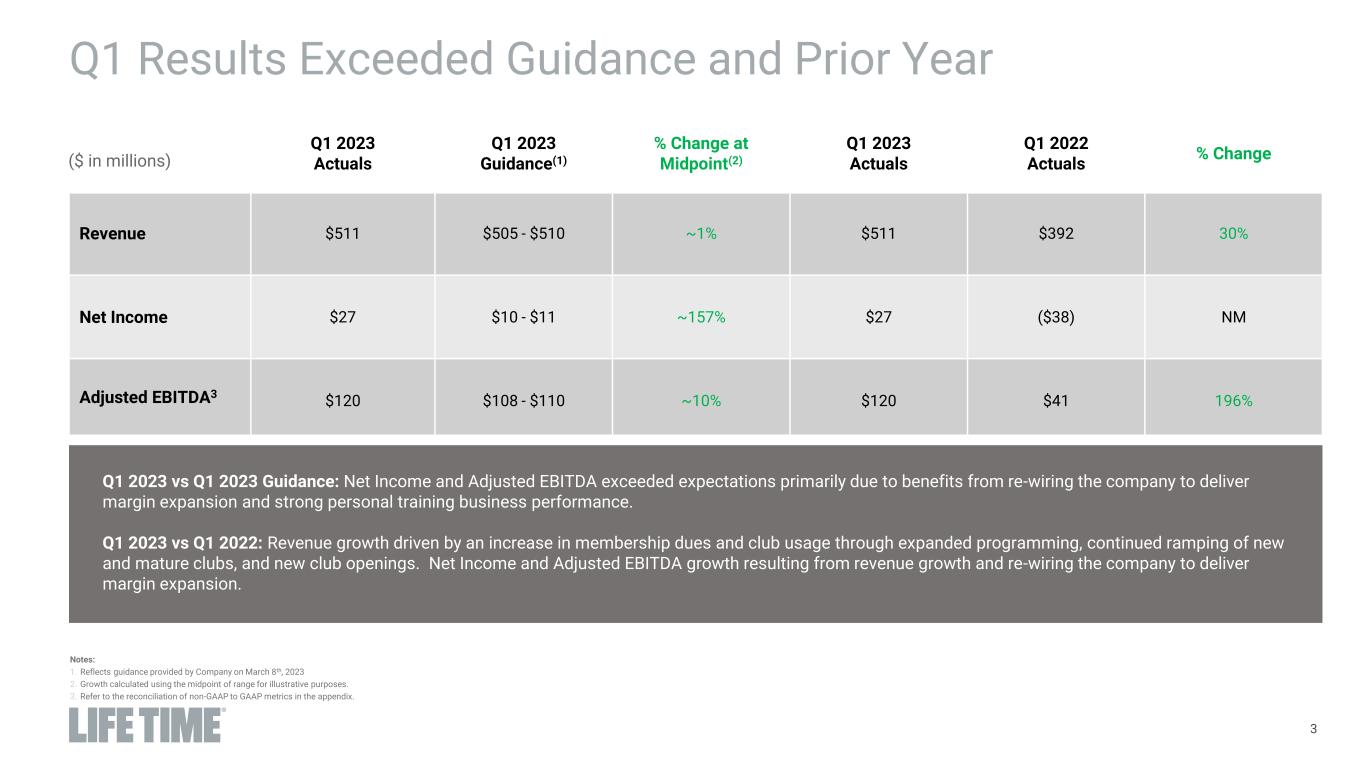
Presentation_08.02.21_v08.pptx 3 Q1 Results Exceeded Guidance and Prior Year Q1 2023 vs Q1 2023 Guidance: Net Income and Adjusted EBITDA exceeded expectations primarily due to benefits from re-wiring the company to deliver margin expansion and strong personal training business performance. Q1 2023 vs Q1 2022: Revenue growth driven by an increase in membership dues and club usage through expanded programming, continued ramping of new and mature clubs, and new club openings. Net Income and Adjusted EBITDA growth resulting from revenue growth and re-wiring the company to deliver margin expansion. Notes: 1. Reflects guidance provided by Company on March 8th, 2023 2. Growth calculated using the midpoint of range for illustrative purposes. 3. Refer to the reconciliation of non-GAAP to GAAP metrics in the appendix. Q1 2023 Actuals Q1 2023 Guidance(1) % Change at Midpoint(2) Q1 2023 Actuals Q1 2022 Actuals % Change Revenue $511 $505 - $510 ~1% $511 $392 30% Net Income $27 $10 - $11 ~157% $27 ($38) NM Adjusted EBITDA3 $120 $108 - $110 ~10% $120 $41 196% ($ in millions)
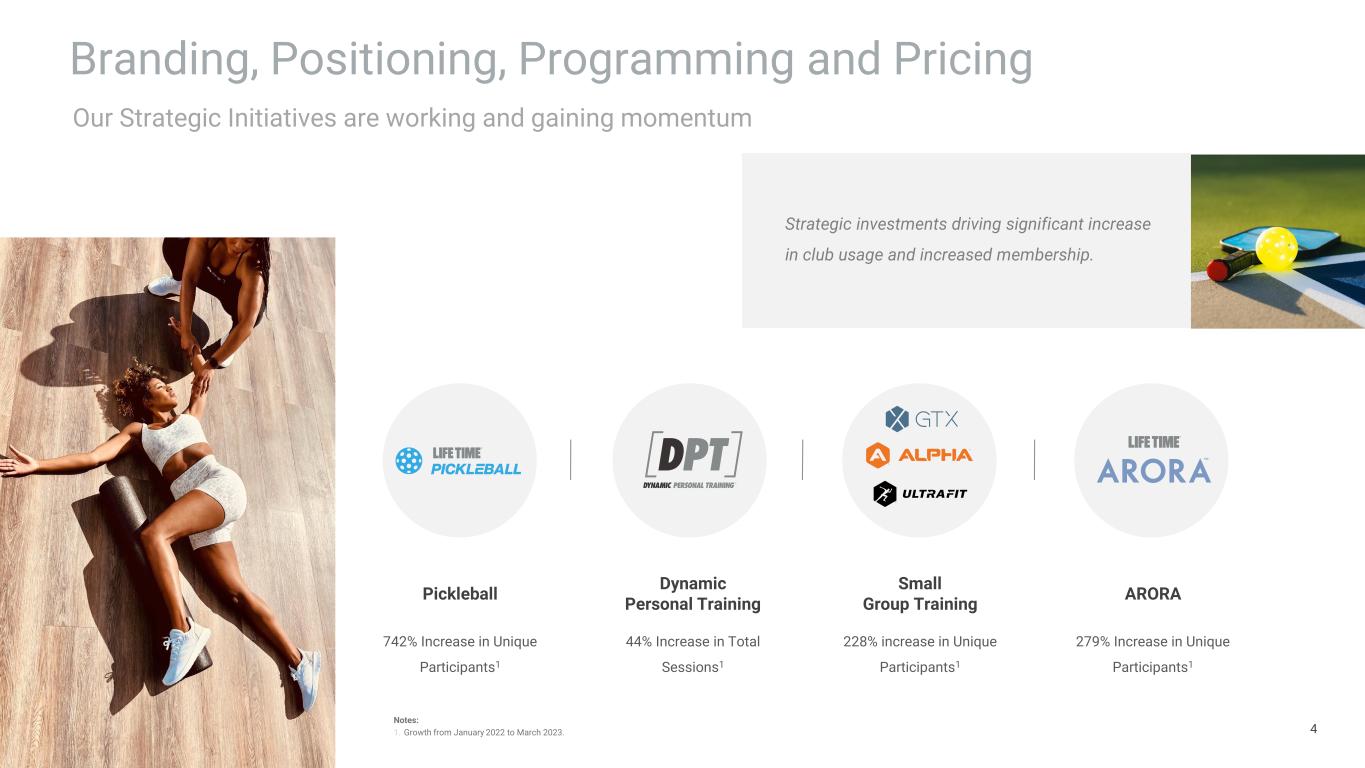
Presentation_08.02.21_v08.pptx 4 Branding, Positioning, Programming and Pricing Pickleball 742% Increase in Unique Participants1 Dynamic Personal Training 44% Increase in Total Sessions1 Small Group Training 228% increase in Unique Participants1 ARORA 279% Increase in Unique Participants1 Strategic investments driving significant increase in club usage and increased membership. Notes: 1. Growth from January 2022 to March 2023. Our Strategic Initiatives are working and gaining momentum
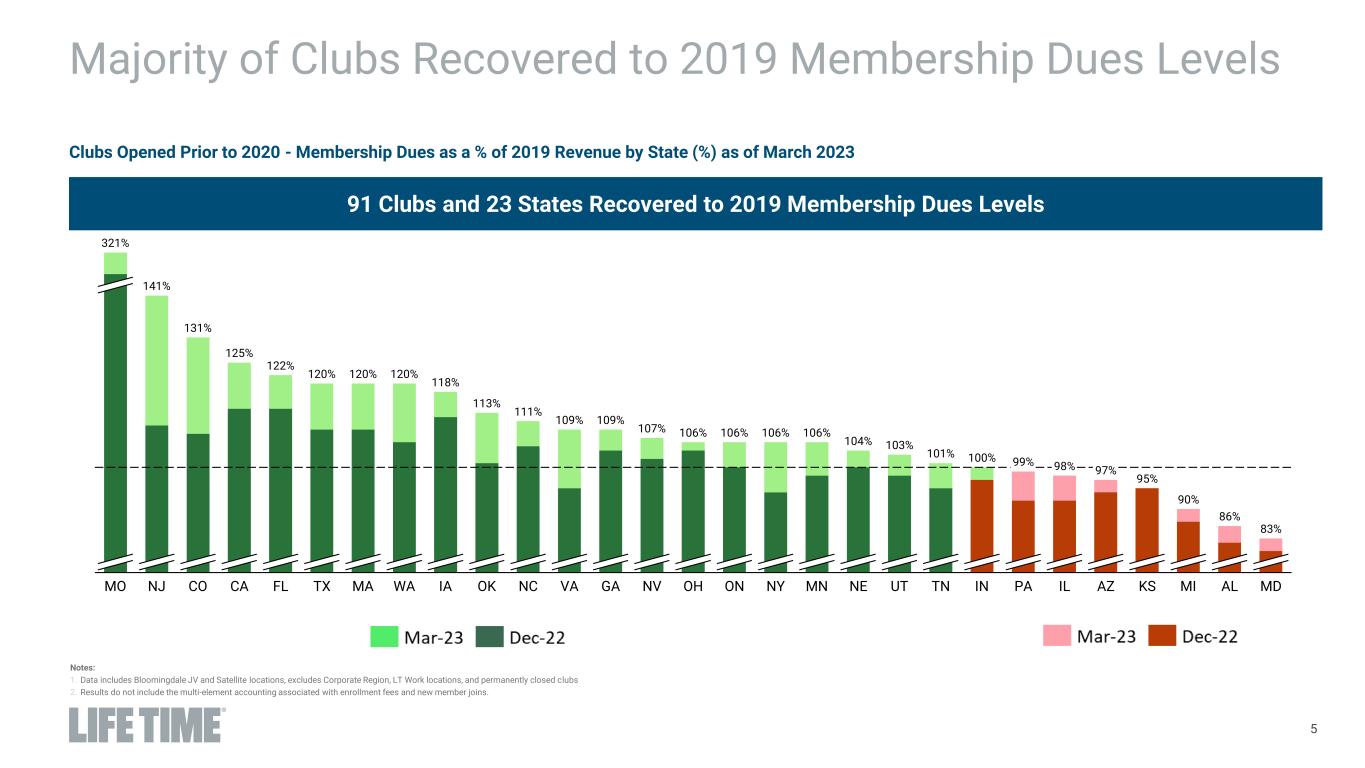
Presentation_08.02.21_v08.pptx 5 Majority of Clubs Recovered to 2019 Membership Dues Levels MO NJ CO CA FL TX MA WA IA OK NC VA GA NV OH ON NY MN NE TN IN PA IL AZ MI AL MDKS 321% 141% 131% 100% 111% 106% 97% 113% 99% 106% UT 101% 106% 118% 106% 95% 120% 83% 107% 120% 103% 90% 120% 109% 98% 122% 104% 109% 125% 86% Notes: 1. Data includes Bloomingdale JV and Satellite locations, excludes Corporate Region, LT Work locations, and permanently closed clubs 2. Results do not include the multi-element accounting associated with enrollment fees and new member joins. 91 Clubs and 23 States Recovered to 2019 Membership Dues Levels Clubs Opened Prior to 2020 - Membership Dues as a % of 2019 Revenue by State (%) as of March 2023
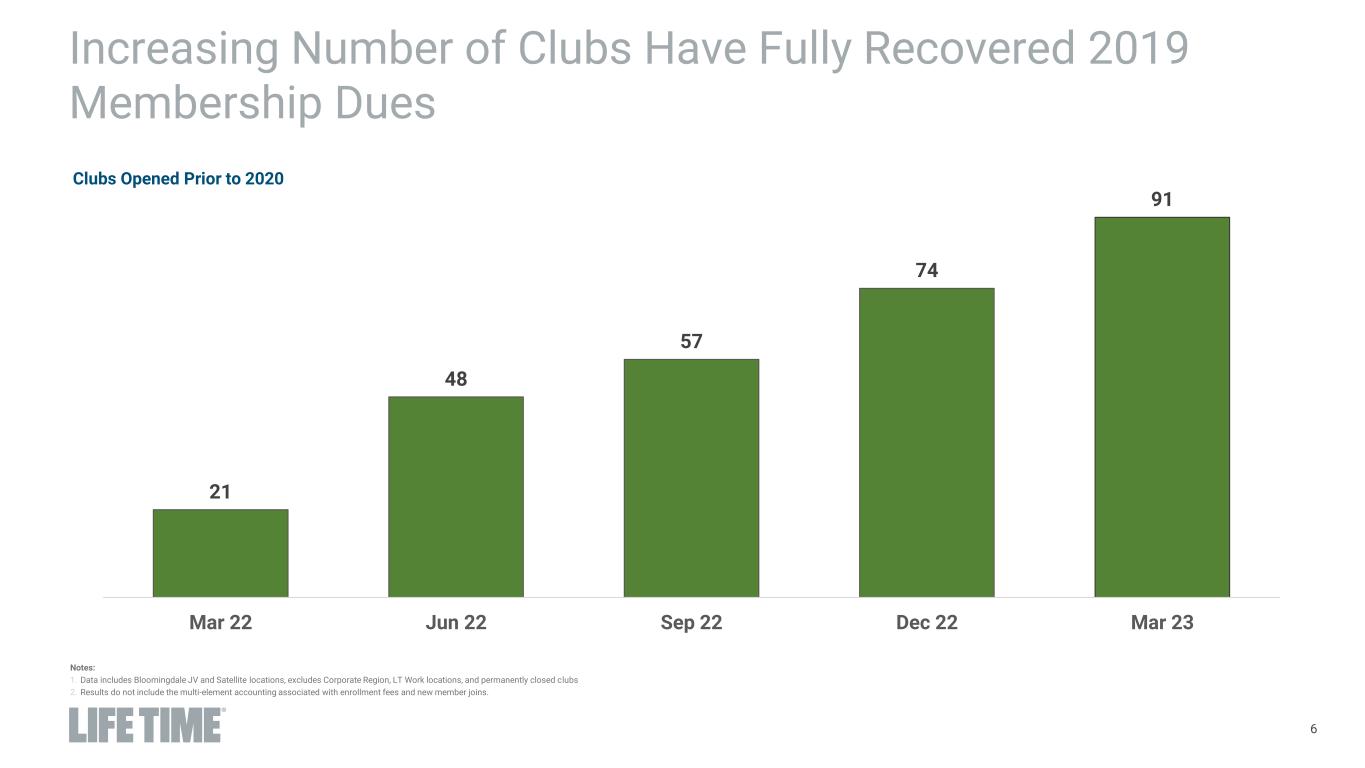
Presentation_08.02.21_v08.pptx 6 21 48 57 74 91 Mar 22 Jun 22 Sep 22 Dec 22 Mar 23 Increasing Number of Clubs Have Fully Recovered 2019 Membership Dues Clubs Opened Prior to 2020 Notes: 1. Data includes Bloomingdale JV and Satellite locations, excludes Corporate Region, LT Work locations, and permanently closed clubs 2. Results do not include the multi-element accounting associated with enrollment fees and new member joins.
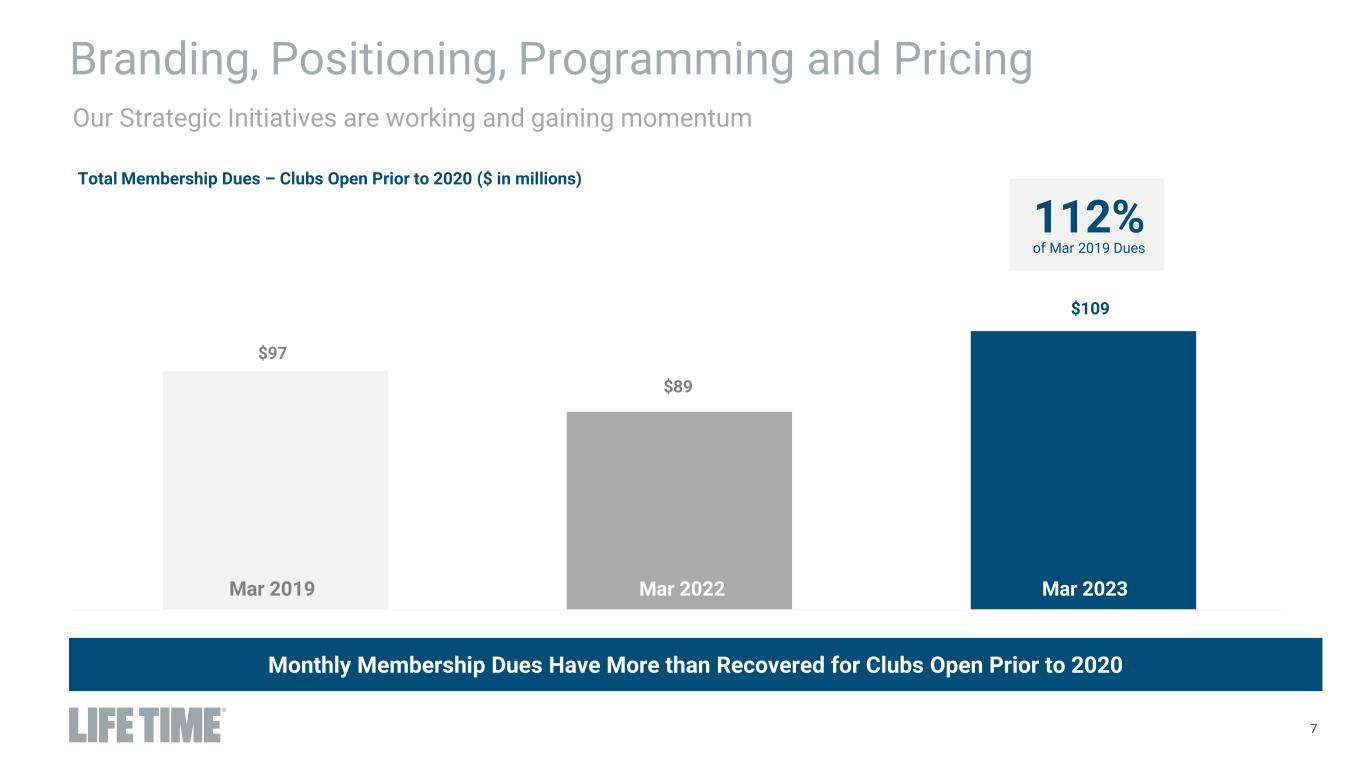
Presentation_08.02.21_v08.pptx 7 Branding, Positioning, Programming and Pricing $97 $89 $109 Mar 2019 Mar 2022 Mar 2023 Est Total Membership Dues – Clubs Open Prior to 2020 ($ in millions) Monthly Membership Dues Have More than Recovered for Clubs Open Prior to 2020 Mar 2023Mar 2019 Mar 2022 112% of Mar 2019 Dues Our Strategic Initiatives are working and gaining momentum
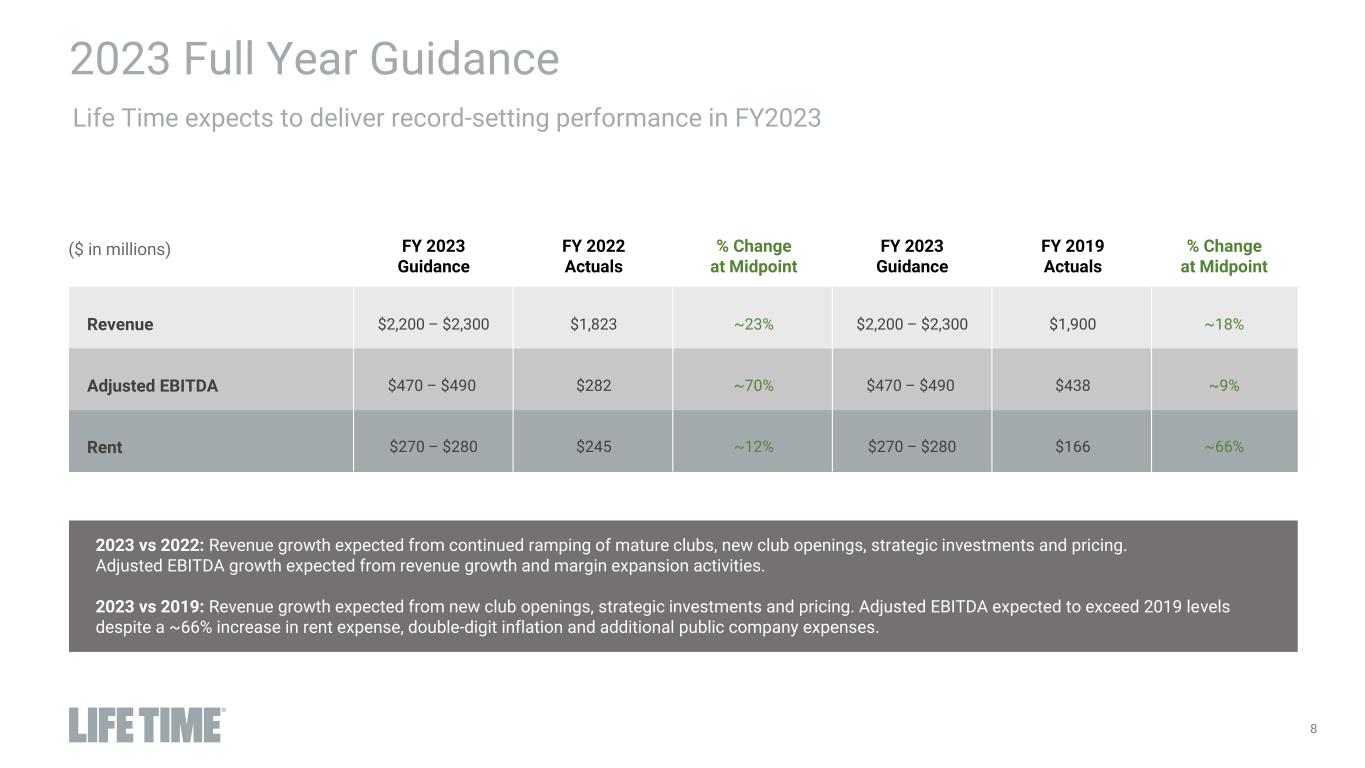
8 2023 Full Year Guidance Life Time expects to deliver record-setting performance in FY2023 FY 2023 Guidance Revenue Adjusted EBITDA Rent $2,200 – $2,300 $470 – $490 $270 – $280 2023 vs 2022: Revenue growth expected from continued ramping of mature clubs, new club openings, strategic investments and pricing. Adjusted EBITDA growth expected from revenue growth and margin expansion activities. 2023 vs 2019: Revenue growth expected from new club openings, strategic investments and pricing. Adjusted EBITDA expected to exceed 2019 levels despite a ~66% increase in rent expense, double-digit inflation and additional public company expenses. FY 2022 Actuals $1,823 $282 $245 % Change at Midpoint ~23% ~70% ~12% FY 2023 Guidance $2,200 – $2,300 $470 – $490 $270 – $280 FY 2019 Actuals $1,900 $438 $166 % Change at Midpoint ~18% ~9% ~66% ($ in millions)
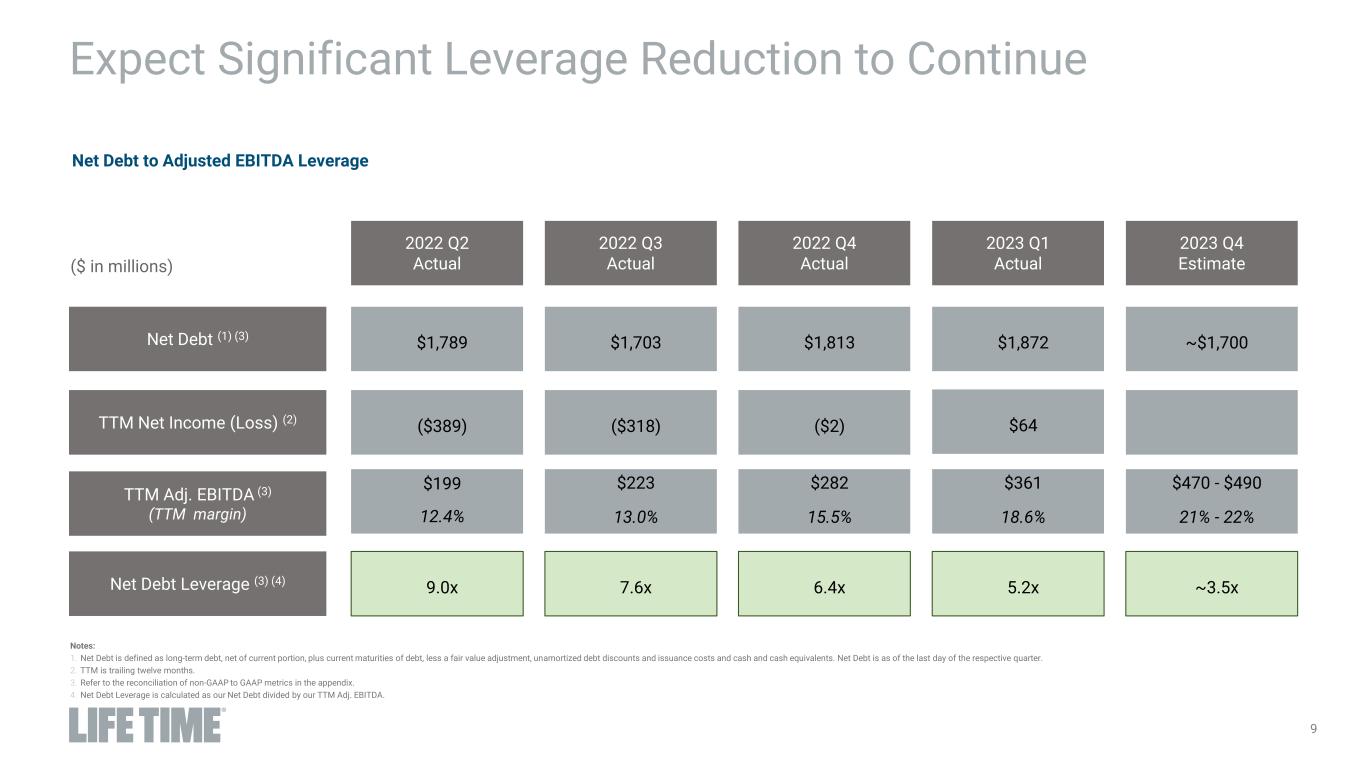
9 Expect Significant Leverage Reduction to Continue Net Debt to Adjusted EBITDA Leverage TTM Adj. EBITDA (3) (TTM margin) Net Debt (1) (3) $223 13.0% $1,703 2022 Q3 Actual $199 12.4% $1,789 2022 Q2 Actual Net Debt Leverage (3) (4) 7.6x9.0x $282 15.5% $1,813 2022 Q4 Actual 6.4x $361 18.6% $1,872 2023 Q1 Actual 5.2x $470 - $490 21% - 22% ~$1,700 2023 Q4 Estimate ~3.5x TTM Net Income (Loss) (2) ($318)($389) ($2) Notes: 1. Net Debt is defined as long-term debt, net of current portion, plus current maturities of debt, less a fair value adjustment, unamortized debt discounts and issuance costs and cash and cash equivalents. Net Debt is as of the last day of the respective quarter. 2. TTM is trailing twelve months. 3. Refer to the reconciliation of non-GAAP to GAAP metrics in the appendix. 4. Net Debt Leverage is calculated as our Net Debt divided by our TTM Adj. EBITDA. $64 ($ in millions)
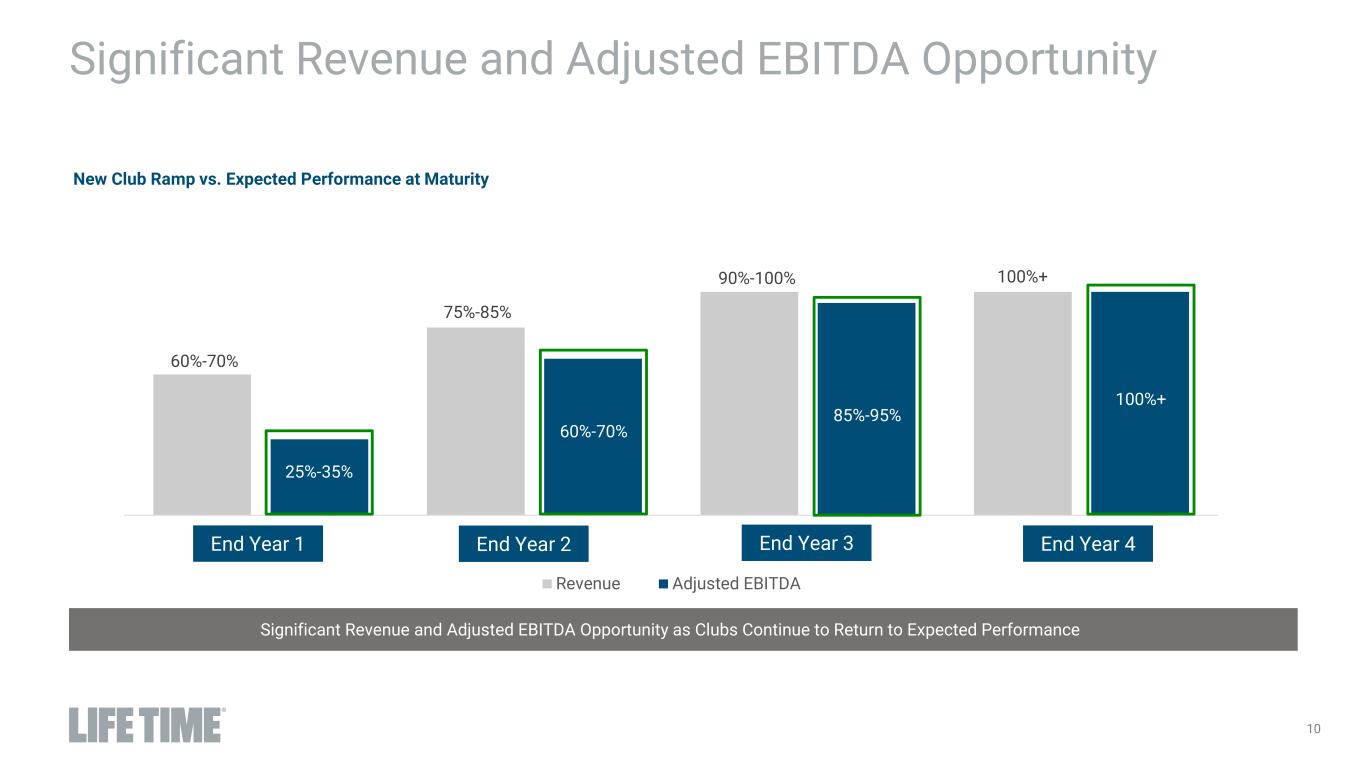
10 Significant Revenue and Adjusted EBITDA Opportunity New Club Ramp vs. Expected Performance at Maturity end Year 1 end Year 2 end Year 3 end Year 4+ Revenue Adjusted EBITDA 90%-100% 75%-85% 25%-35% 60%-70% 100%+ Significant Revenue and Adjusted EBITDA Opportunity as Clubs Continue to Return to Expected Performance End Year 1 End Year 2 End Year 3 End Year 4 25%-35% 60%-70% 85%-95% 100%+
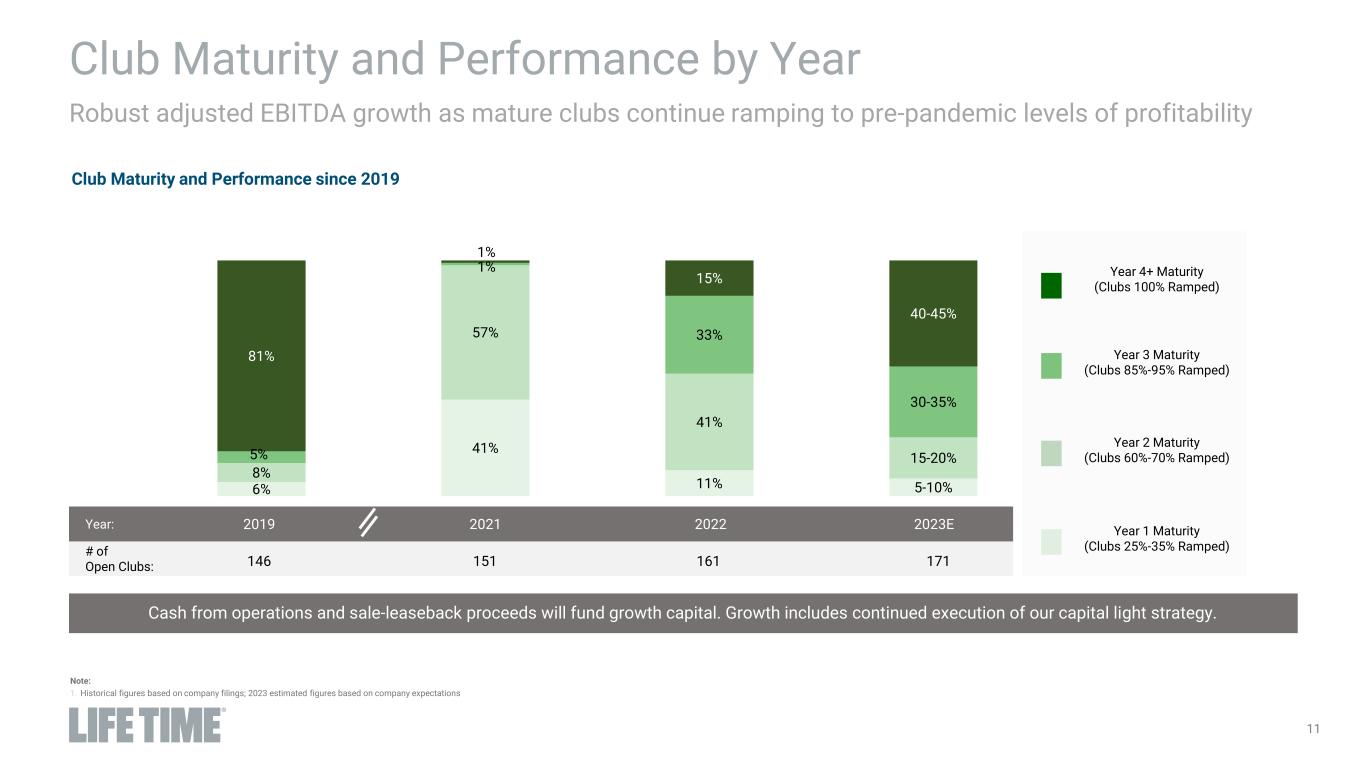
11 Club Maturity and Performance by Year 6% 41% 11% 5-10% 8% 57% 41% 15-20%5% 1% 33% 30-35% 81% 1% 15% 40-45% Cash from operations and sale-leaseback proceeds will fund growth capital. Growth includes continued execution of our capital light strategy. Year 4+ Maturity (Clubs 100% Ramped) # of Open Clubs: 2019 146 151 161 171 Year 3 Maturity (Clubs 85%-95% Ramped) Year 2 Maturity (Clubs 60%-70% Ramped) Year 1 Maturity (Clubs 25%-35% Ramped) Year: 2021 2022 2023E Robust adjusted EBITDA growth as mature clubs continue ramping to pre-pandemic levels of profitability Club Maturity and Performance since 2019 Note: 1. Historical figures based on company filings; 2023 estimated figures based on company expectations
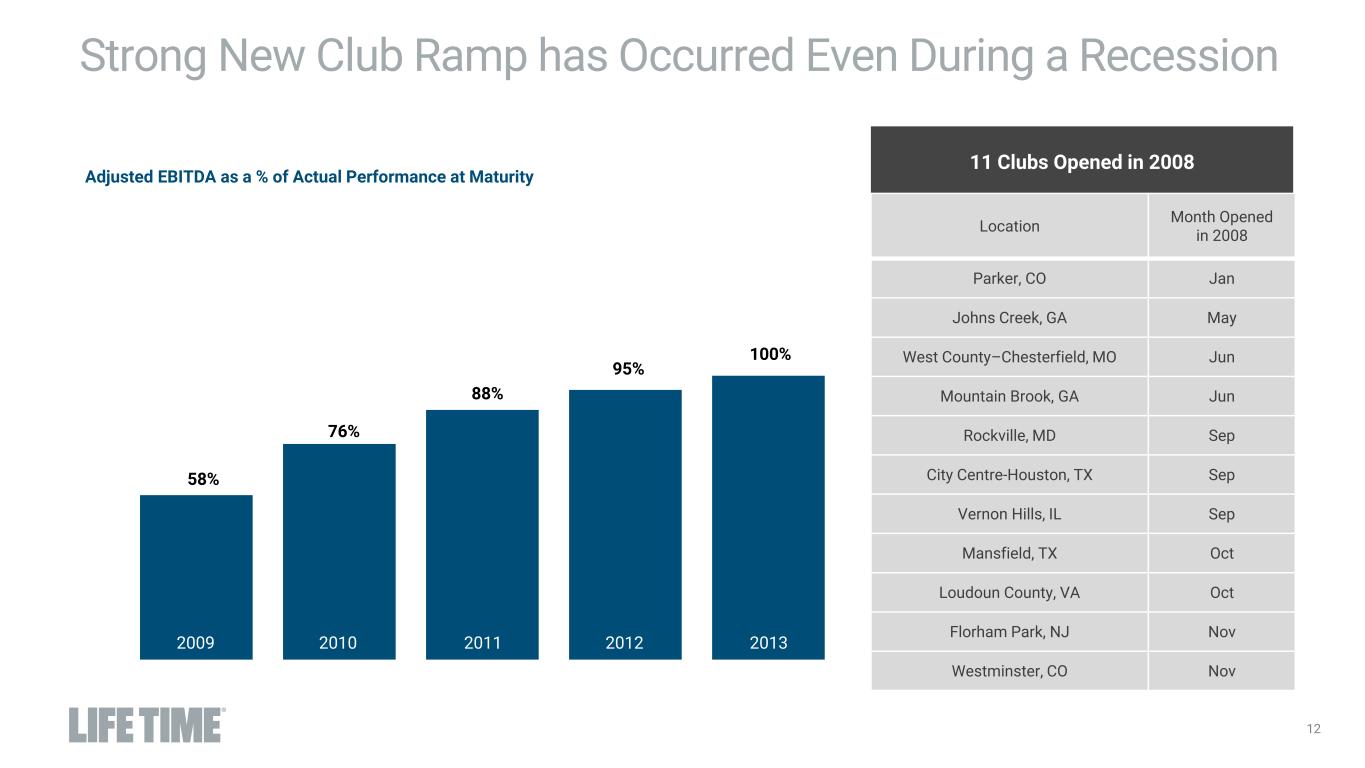
12 58% 76% 88% Adjusted EBITDA as a % of Actual Performance at Maturity 11 Clubs Opened in 2008 95% 100% 2009 2010 2011 2012 2013 Location Month Opened in 2008 Parker, CO Jan Johns Creek, GA May West County–Chesterfield, MO Jun Mountain Brook, GA Jun Rockville, MD Sep City Centre-Houston, TX Sep Vernon Hills, IL Sep Mansfield, TX Oct Loudoun County, VA Oct Florham Park, NJ Nov Westminster, CO Nov Strong New Club Ramp has Occurred Even During a Recession Adjusted EBITDA as a % of Actual Performance at Maturity
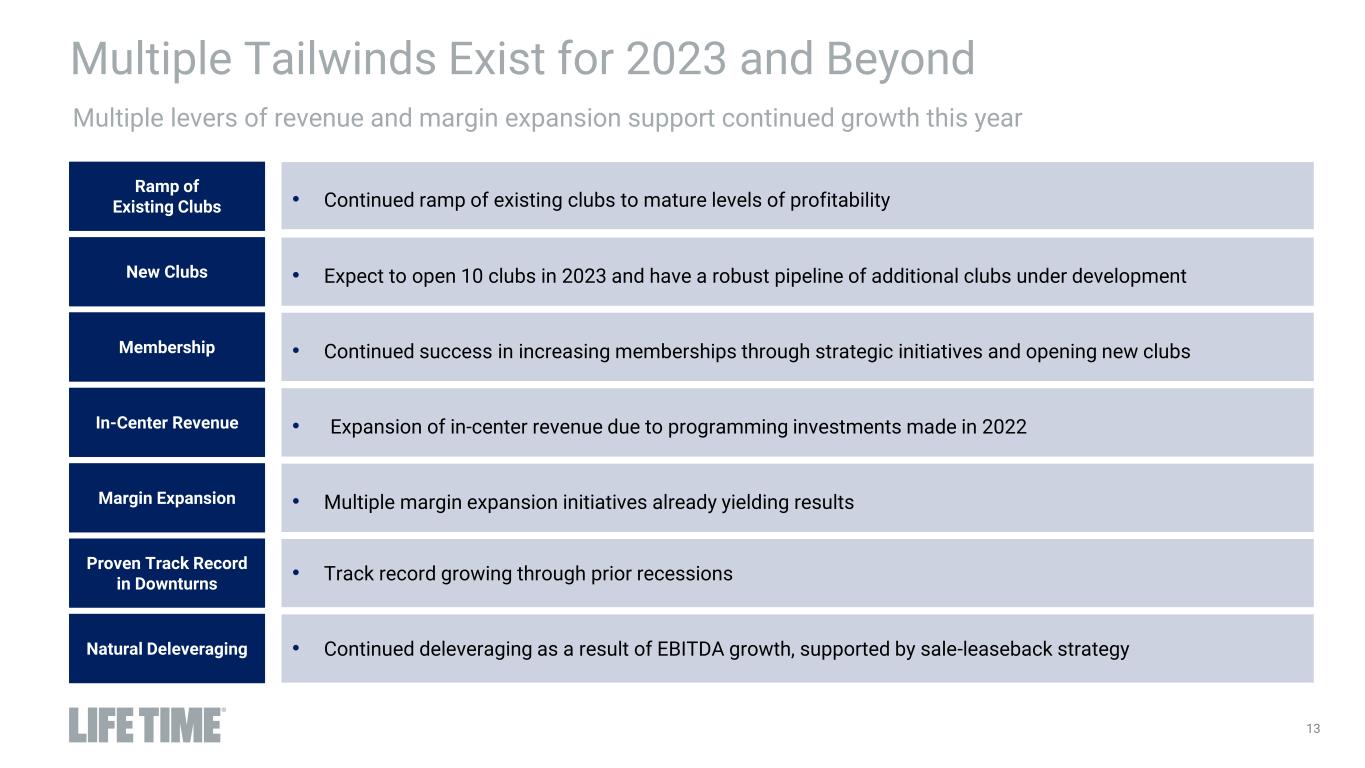
13 Multiple levers of revenue and margin expansion support continued growth this year Multiple Tailwinds Exist for 2023 and Beyond Ramp of Existing Clubs New Clubs Membership Margin Expansion Proven Track Record in Downturns In-Center Revenue Natural Deleveraging • Continued ramp of existing clubs to mature levels of profitability • Expect to open 10 clubs in 2023 and have a robust pipeline of additional clubs under development • Continued success in increasing memberships through strategic initiatives and opening new clubs • Multiple margin expansion initiatives already yielding results • Track record growing through prior recessions • Expansion of in-center revenue due to programming investments made in 2022 • Continued deleveraging as a result of EBITDA growth, supported by sale-leaseback strategy
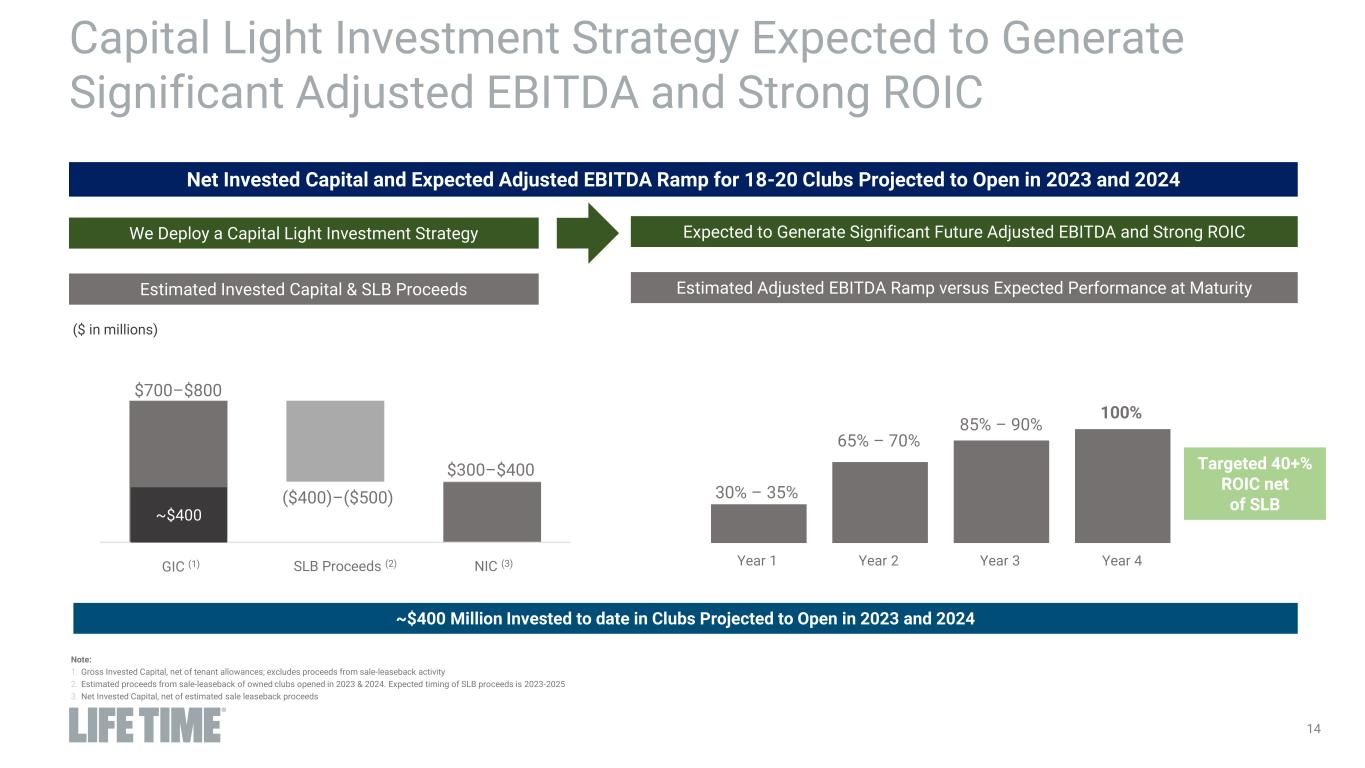
14 Capital Light Investment Strategy Expected to Generate Significant Adjusted EBITDA and Strong ROIC Note: 1. Gross Invested Capital, net of tenant allowances; excludes proceeds from sale-leaseback activity 2. Estimated proceeds from sale-leaseback of owned clubs opened in 2023 & 2024. Expected timing of SLB proceeds is 2023-2025 3. Net Invested Capital, net of estimated sale leaseback proceeds 30% – 35% 65% – 70% 85% – 90% ~$400 Million Invested to date in Clubs Projected to Open in 2023 and 2024 We Deploy a Capital Light Investment Strategy Expected to Generate Significant Future Adjusted EBITDA and Strong ROIC 100% Estimated Adjusted EBITDA Ramp versus Expected Performance at Maturity Estimated Invested Capital & SLB Proceeds ~$400 $700–$800 ($400)–($500) $300–$400 Year 1 Year 2 Year 3 Year 4 Targeted 40+% ROIC net of SLB Net Invested Capital and Expected Adjusted EBITDA Ramp for 18-20 Clubs Projected to Open in 2023 and 2024 ($ in millions) GIC (1) SLB Proceeds (2) NIC (3)
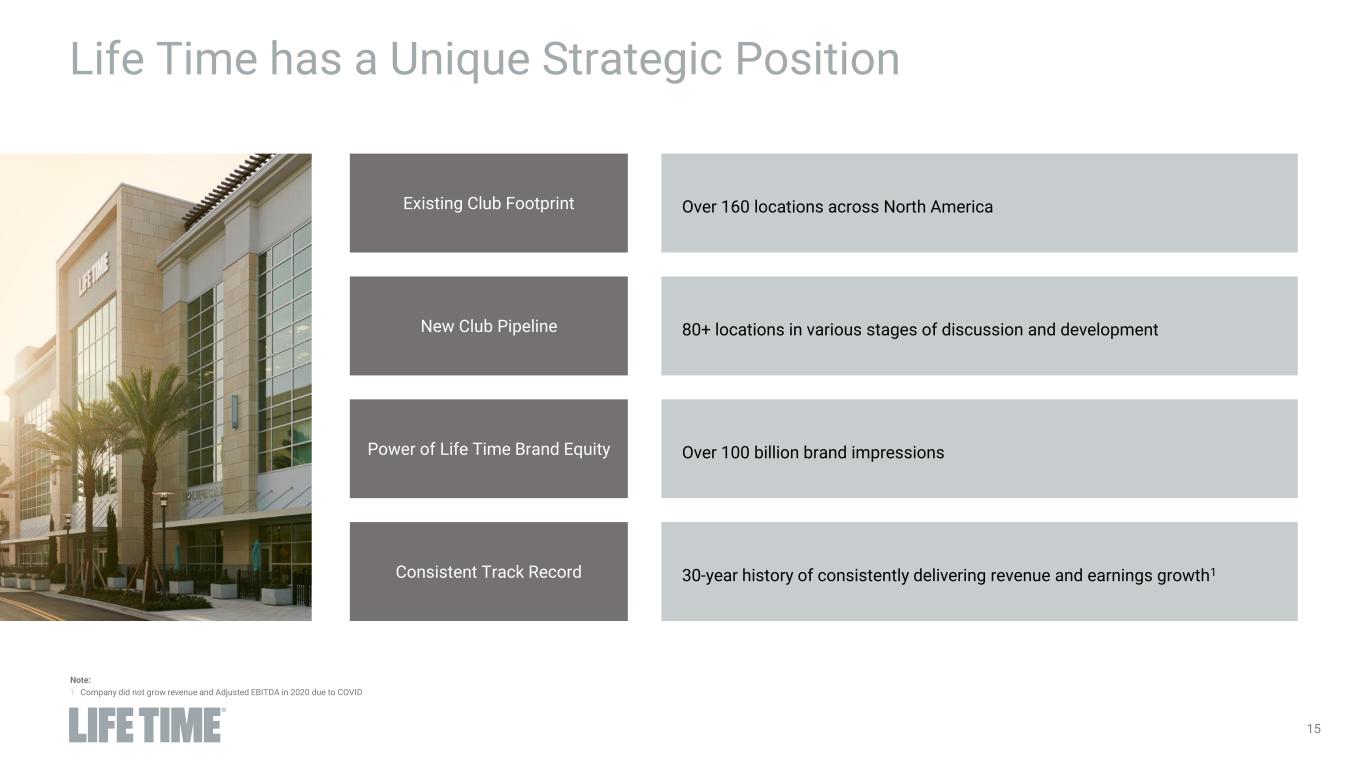
15 Life Time has a Unique Strategic Position Existing Club Footprint New Club Pipeline Power of Life Time Brand Equity Consistent Track Record Over 160 locations across North America 80+ locations in various stages of discussion and development Over 100 billion brand impressions 30-year history of consistently delivering revenue and earnings growth1 Note: 1. Company did not grow revenue and Adjusted EBITDA in 2020 due to COVID
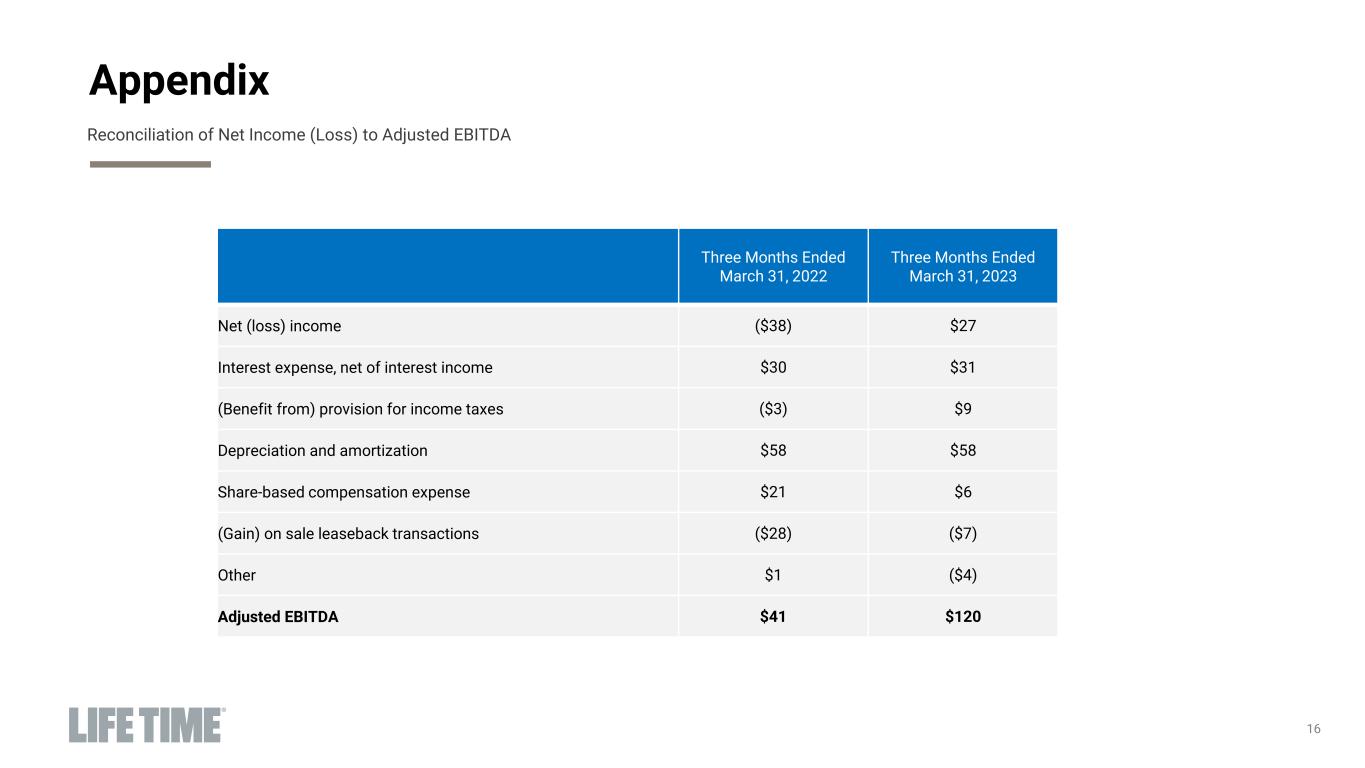
16 Appendix ($MM) Reconciliation of Net Income (Loss) to Adjusted EBITDA Three Months Ended March 31, 2022 Three Months Ended March 31, 2023 Net (loss) income ($38) $27 Interest expense, net of interest income $30 $31 (Benefit from) provision for income taxes ($3) $9 Depreciation and amortization $58 $58 Share-based compensation expense $21 $6 (Gain) on sale leaseback transactions ($28) ($7) Other $1 ($4) Adjusted EBITDA $41 $120
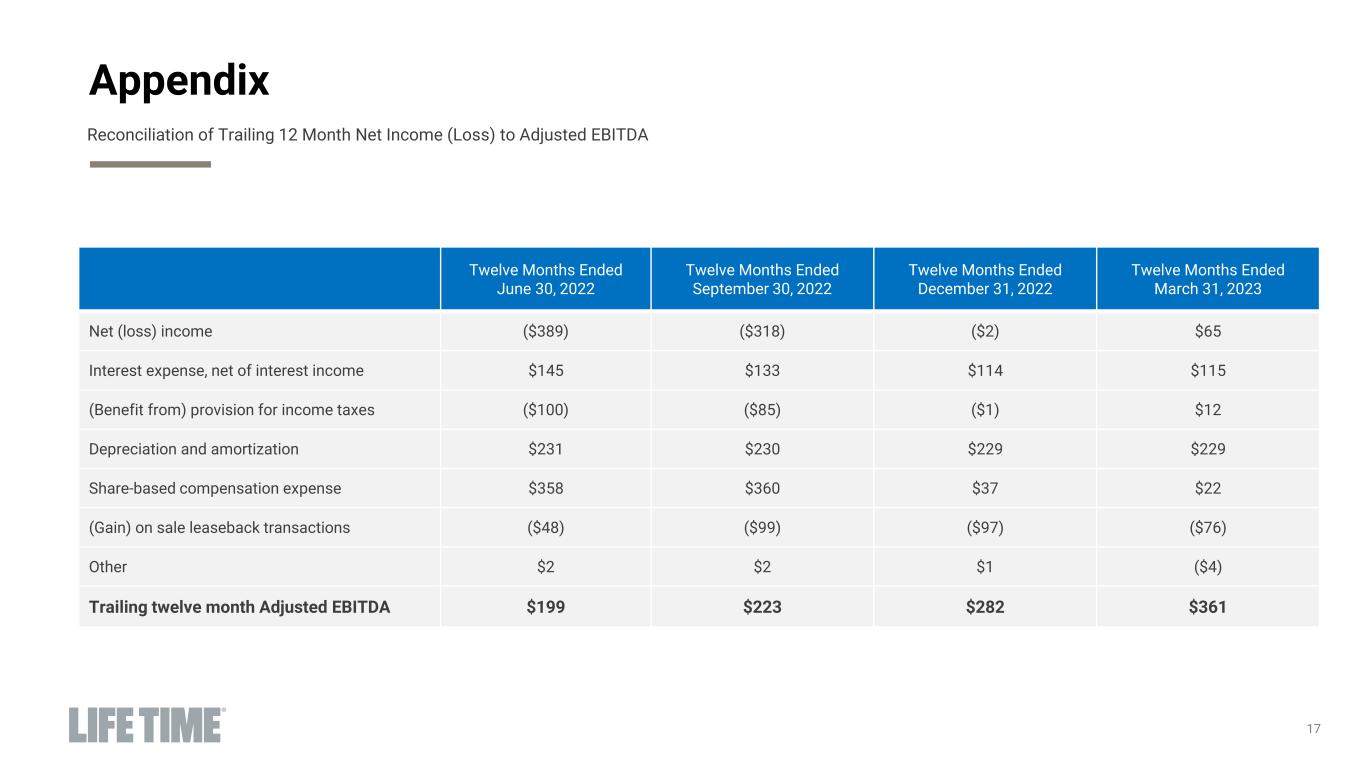
17 Appendix ($MM) Twelve Months Ended June 30, 2022 Twelve Months Ended September 30, 2022 Twelve Months Ended December 31, 2022 Twelve Months Ended March 31, 2023 Net (loss) income ($389) ($318) ($2) $65 Interest expense, net of interest income $145 $133 $114 $115 (Benefit from) provision for income taxes ($100) ($85) ($1) $12 Depreciation and amortization $231 $230 $229 $229 Share-based compensation expense $358 $360 $37 $22 (Gain) on sale leaseback transactions ($48) ($99) ($97) ($76) Other $2 $2 $1 ($4) Trailing twelve month Adjusted EBITDA $199 $223 $282 $361 Reconciliation of Trailing 12 Month Net Income (Loss) to Adjusted EBITDA
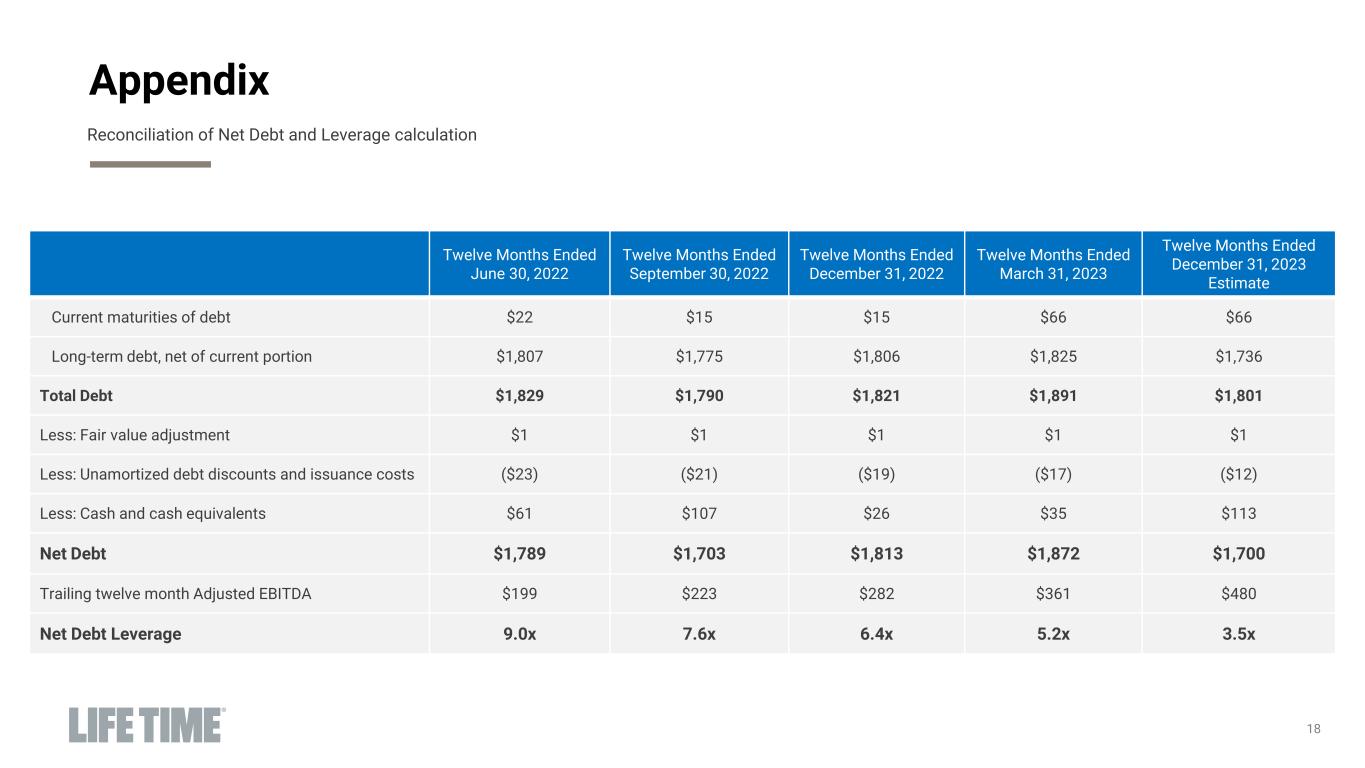
18 Appendix ($MM) Twelve Months Ended June 30, 2022 Twelve Months Ended September 30, 2022 Twelve Months Ended December 31, 2022 Twelve Months Ended March 31, 2023 Twelve Months Ended December 31, 2023 Estimate Current maturities of debt $22 $15 $15 $66 $66 Long-term debt, net of current portion $1,807 $1,775 $1,806 $1,825 $1,736 Total Debt $1,829 $1,790 $1,821 $1,891 $1,801 Less: Fair value adjustment $1 $1 $1 $1 $1 Less: Unamortized debt discounts and issuance costs ($23) ($21) ($19) ($17) ($12) Less: Cash and cash equivalents $61 $107 $26 $35 $113 Net Debt $1,789 $1,703 $1,813 $1,872 $1,700 Trailing twelve month Adjusted EBITDA $199 $223 $282 $361 $480 Net Debt Leverage 9.0x 7.6x 6.4x 5.2x 3.5x Reconciliation of Net Debt and Leverage calculation